Development environment
ETStudio main interface
The main interface of ETStudio is divided into quick access toolbar, menu access area, ribbon area, and workspace. Click the green start icon
![]() in the upper left corner to run the simulation project, start Measurement.
in the upper left corner to run the simulation project, start Measurement.
ETStudio tab and ribbon
The tab mainly has the following ribbon section, click the tab tab, the ribbon will display the tab's function, users can operate the corresponding function or easily enter the relevant window.
The main interface of ETStudio is divided into the following functional areas
1.File
2.Home
3.Device
4.Setup
5.Simulation
6.Datalnsight
7.UDS
8.ETO
9.Tools
10.AI
11.XCP
12.Help
At the top of the ETStudio software is the default quick access toolbar (including start, stop, open, new, save, save as, and options, etc.)
File menu
The File menu is mainly used for operations and attribute settings of project files
File menu options and function descriptions
| Menu Option | Description |
|---|---|
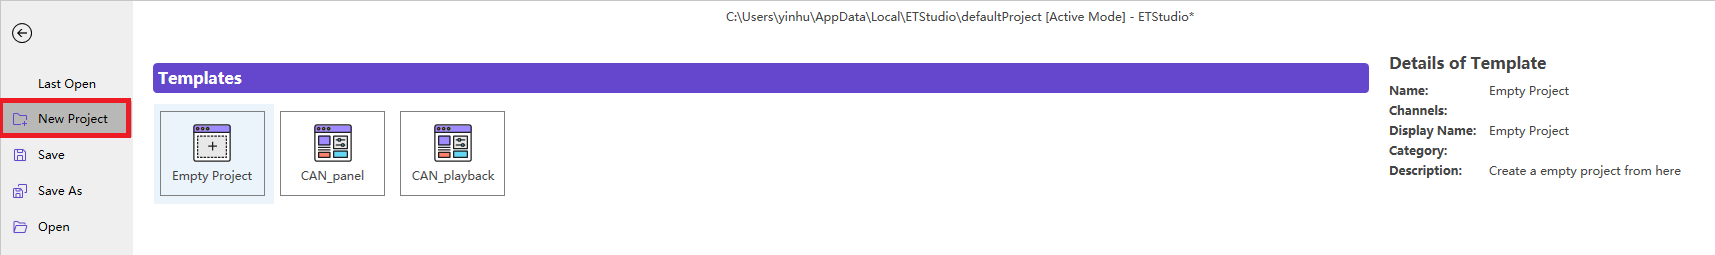
| Last open | Lists recently used project files |
| New project | Create a new project file. Can be created based on templates |
| Save | Save the project file |
| Save As | Save the project file to a new folder or as a new file name |
| Open | Select and open a project file |
Home ribbon area
The Home ribbon mainly includes the measurement component, display component, and other components, as shown in the figure.
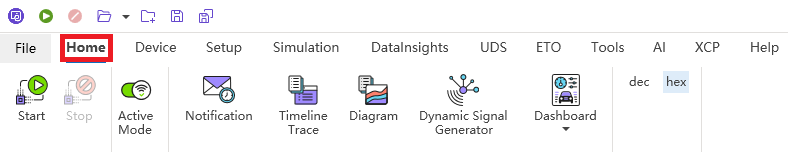
The following table lists the main icons of the Home ribbon and their function descriptions.
| Icon | Function Description |
|---|---|
| Start: After the project file is compiled, click this icon to start running | |
| Stop: Click this icon to stop the measurement | |
| Active / Inactive Mode: Active Mode: Simulation measurement is based on real hardware connection or simulation mode Inactive Mode: Use recorded measurement values from log files (e.g., BLF, ASC, MF4) | |
 | Notification: Click this icon to view the running status of messages and set the operation message display |
 | Timeline Trace: The main purpose of the Trace window is to record and display all activities during the measurement process. All information from the input module is received and displayed line by line in this window |
 | Diagram: In the Diagram window, signals, variables, and diagnostic parameters can be displayed in graphical form (XY graph). The user can configure the X-axis as time or other variables |
 | Dynamic Signal Generator: Use the Interactive Generator to send messages or change specific values during the measurement process |
 | Dashboard: The Dashboard is mainly used for graphical operation or display of signals and variables |
| Set the number display to decimal or hexadecimal format |
Device ribbon area
The device ribbon mainly includes device-related channel components and measurement component control.
Device ribbon interface
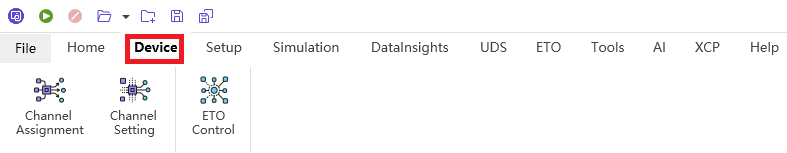
The following table lists the main icons of the Device ribbon and their feature descriptions
| Icon | Function Description |
|---|---|
 | Channel Assignment: Before starting the measurement, ETStudio will detect current incorrect channel configurations and provide reasonable channel configuration suggestions based on current hardware conditions |
 | Channel Setting: Change the settings of currently available channels through network hardware configuration |
 | ETO Control: The output settings interface will display real-time AI/DI data and control DO channels |
Setup ribbon area
The Setup ribbon mainly includes object components and packet playback.
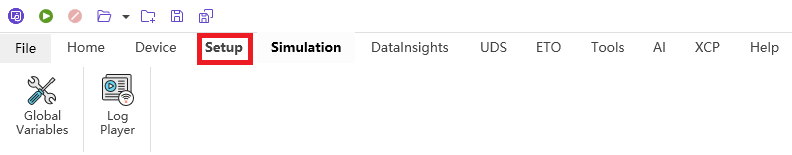
The following table lists the main icons of the Setup ribbon and their feature descriptions
| Icon | Function Description |
|---|---|
 | Global Variables: Manage system variables used in ETStudio |
 | Log Player: Allows users to replay previously recorded data or events without real-time connection |
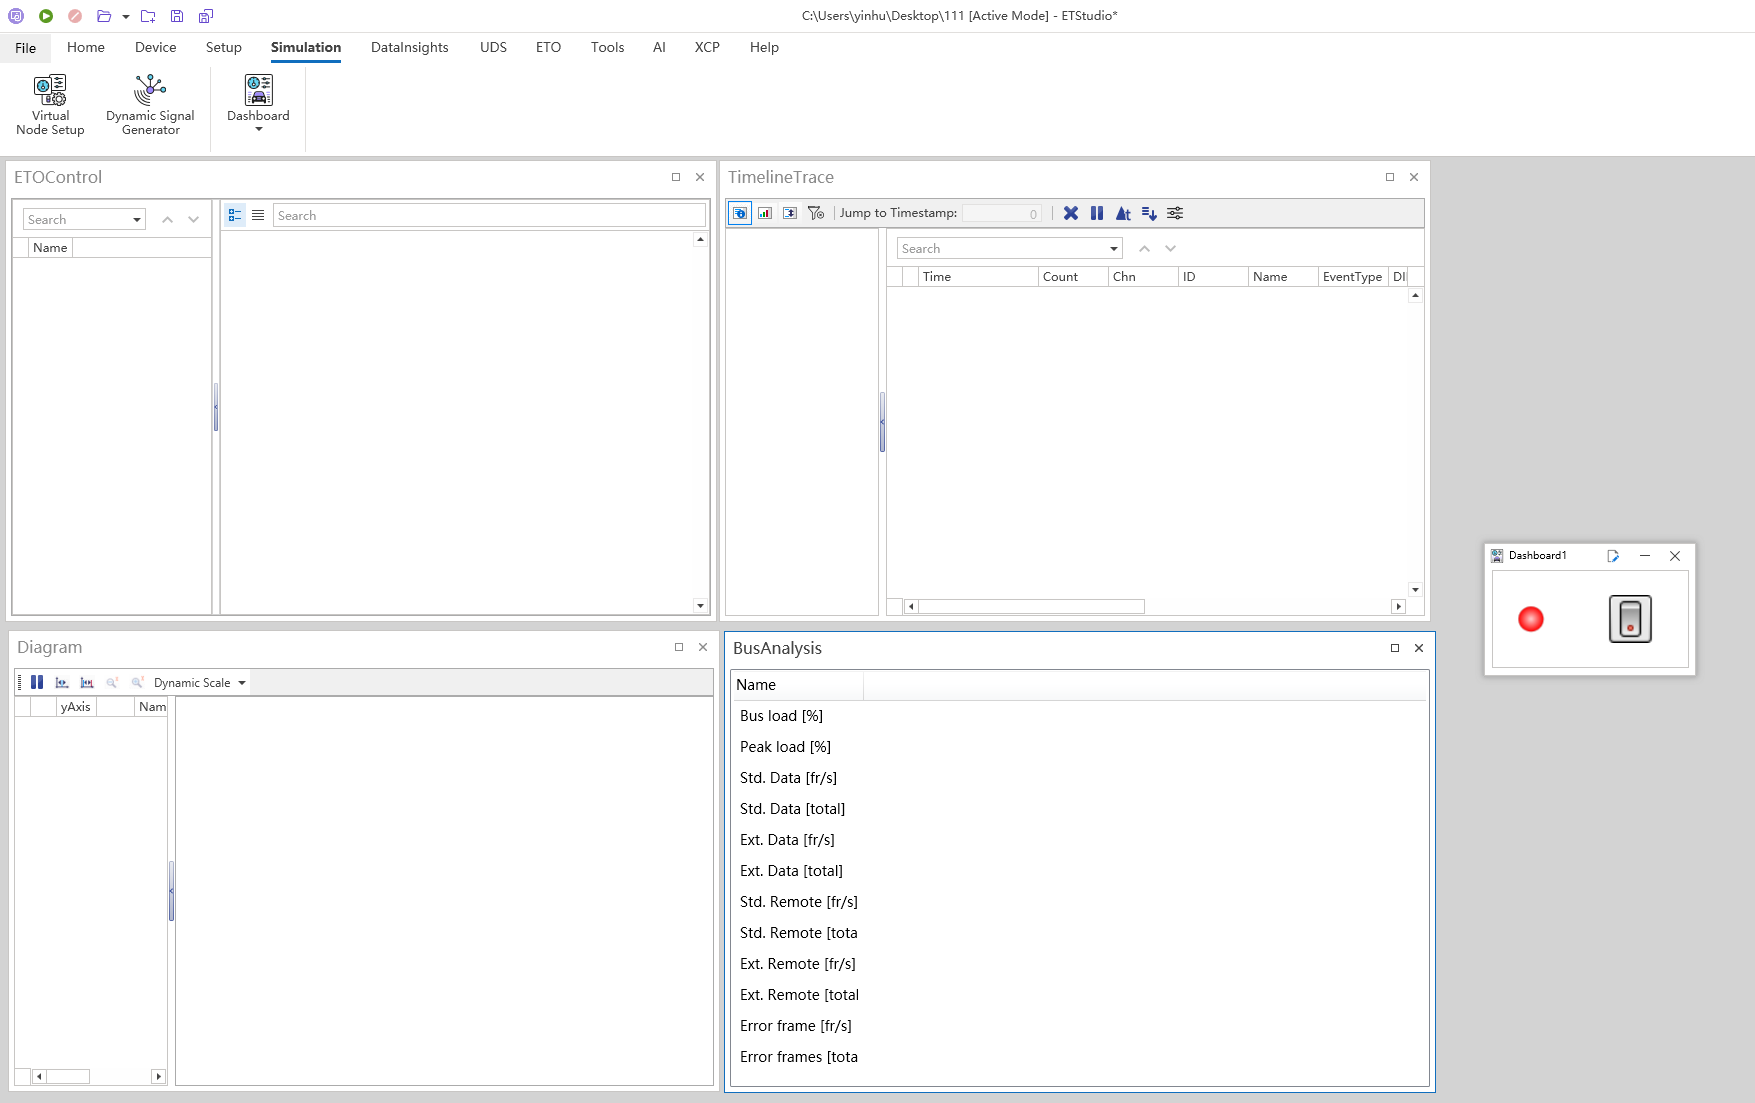
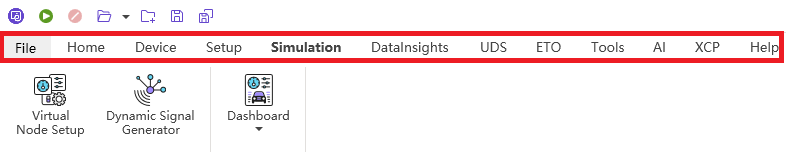
Simulation ribbon area
Smiulation Ribbon Interface
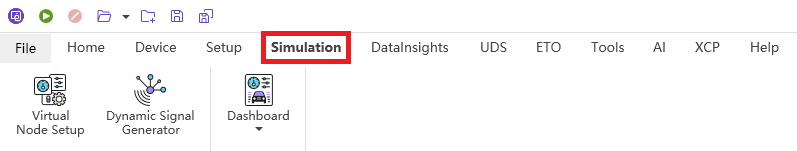
The following table lists the main icons of the Smiulation ribbon and their function descriptions
| Icon | Function Description |
|---|---|
 | Virtual Node Setup: Graphically displays the networks, devices, and all network nodes contained in the system This window contains all parameter settings for Simulation Setup |
 | Dynamic Signal Generator: Use the Interactive Generator to send messages or change specific values during the measurement process |
| Dashboard: The Dashboard is mainly used for graphical operation or display of signals and variables |
Datalnsights ribbon area
Datalnsights Ribbon Interface
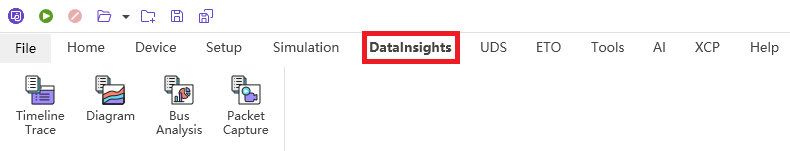
The following table lists the main icons of the Datalnsights ribbon and their function descriptions
| Icon | Function Description |
|---|---|
 | Timeline Trace: The main purpose of the Timeline Trace window is to record and display all activities during the measurement process. All information from the input module is received and displayed line by line in this window |
 | Diagram: In the Diagram window, signals, variables, and diagnostic parameters can be displayed in graphical form (XY graph). The user can configure the X-axis as time or other variables |
 | Bus Analysis: Displays bus activity data during the measurement process |
 | Packet Capture: Used to record bus data to verify ECU functions or diagnose issues |
UDS ribbon area
The UDS ribbon consists of diagnostics-related configuration components, control components, and tool components. The component functions of the UDS ribbon are available only after the corresponding diagnostic profile is added to the UDS/TP, otherwise it is grayed out.
UDS ribbon interface
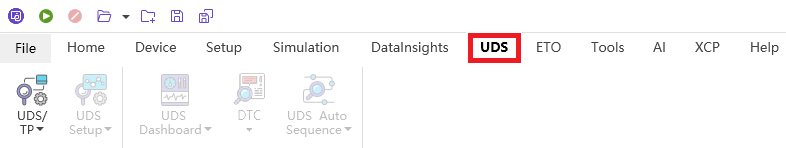
The following table lists the main icons of the UDS ribbon and their function descriptions
| Icon | Function Description |
|---|---|
 | UDS/TP: Users can add diagnostic description files for ECUs through this option |
 | UDS Setup: Users can use the Basic Diagnostics Editor to add simple diagnostic services based on CAN, LIN, CANFD for ECUs |
 | UDS Dashboard: Can directly send single diagnostic service requests to ECUs and analyze diagnostic service responses |
 | DTC: Can directly read the DTC list in the ECU under test. In this window, individual DTCs can also be deleted |
 | UDS Auto Sequence: Users can perform automatic diagnostic tests through the OBD system |
ETO ribbon area
ETO is a printed circuit board (PCB) component that integrates various electronic components, interface circuits, and functional modules, and is the core hardware foundation for electronic devices to achieve specific functions
ETO ribbon interface

The following table lists the main icons of the ETO ribbon and their function descriptions
| Icon | Function Description |
|---|---|
 | ETO (Board Configuration): By matching the connected boards, the functions/system variables of the boards can be configured, and corresponding resistance, voltage, and other values can be output. |
Tools ribbon area
Tools ribbon interface
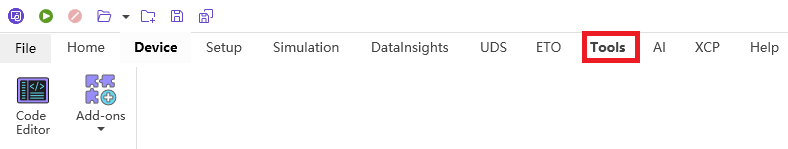
The following table lists the main icons of the Tools ribbon and their function descriptions
| Icon | Function Description |
|---|---|
 | Code Editor: Integrated code programming editor (C++), can open existing projects or create new project plans |
 | Add-ons: Code editor plugins for automotive application development |
AI ribbon area
The AI functional area is mainly for artificial intelligence robots to provide problem-solving and analysis services
Artificial intelligence ribbon interface
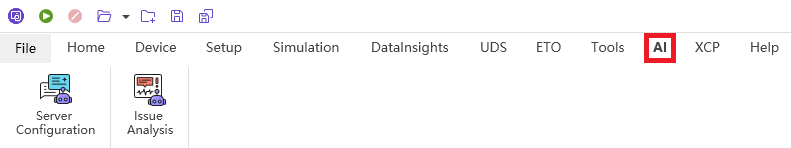
The following table lists the main icons of the AI ribbon and their function descriptions
| Icon | Function Description |
|---|---|
 | Server Configuration: Users can fill in questions to get AI assistance for solutions |
 | Issue Analysis: Perform issue analysis on the service configurator |
XCP ribbon area
The XCP ribbon is mainly for ECU function configuration, specification calibration and other services
XCP ribbon interface
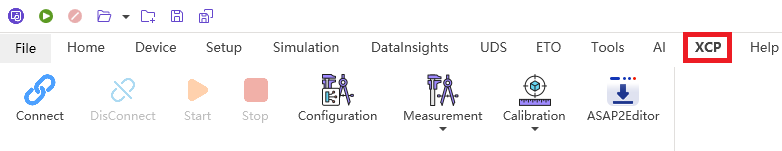
The following table lists the main icons of the XCP ribbon and their function descriptions
| Icon | Function Description |
|---|---|
 | Connect: ECU status connected |
 | Disconnect: ECU status disconnected |
 | Start: Project starts running |
 | Stop: Project stops running |
 | Configuration: Users can configure parameters for ECUs |
 | Measurement: Users can view data in the measurement configuration list |
 | Calibration: Users can view calibration measurement list data |
 | ASAP2Editor: Supports data description and interaction during automotive ECU development, calibration, and testing processes |
Help ribbon area
The Help ribbon is mainly for system version upgrades and operation manuals
Help ribbon interface
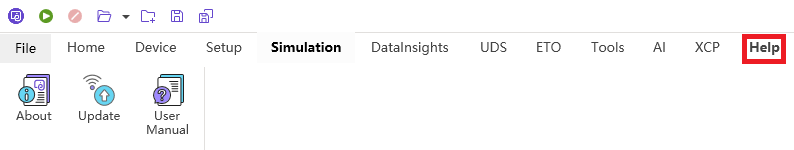
The following table lists the main icons of the Help ribbon and their function descriptions
| Icon | Function Description |
|---|---|
 | About: Users can view ETStudio software system version information |
 | Update: Users can upgrade ETStudio software to the latest version |
 | User Manual: Users can click the button to view the operation manual |
Common simulation windows
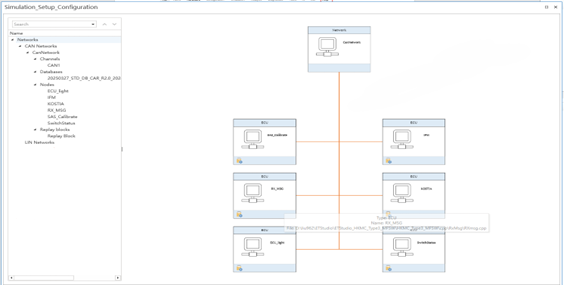
Bus simulation is one of the most important features of ETStudio, and users can set the properties, initial values, and status of the simulation network through a specific simulation window.
UDS Setup Window In the UDS Setup window, all networks, devices, and network nodes are displayed graphically, as shown in the image. In the system view on the left side of this window, you can modify the simulation settings (such as importing DBC files, adding networks, adding channels, etc.), and in the grid view on the right, you can set up, activate, and script the ECU. The UDS Setup window is one of the most commonly used windows to simulate the basic transmission behavior of software components and control units that may occur in a real control unit.
Common diagnostic windows
ETStudio can support powerful diagnostic functions, when users import diagnostic profiles, ETStudio will automatically generate diagnostic test windows for users based on the profile
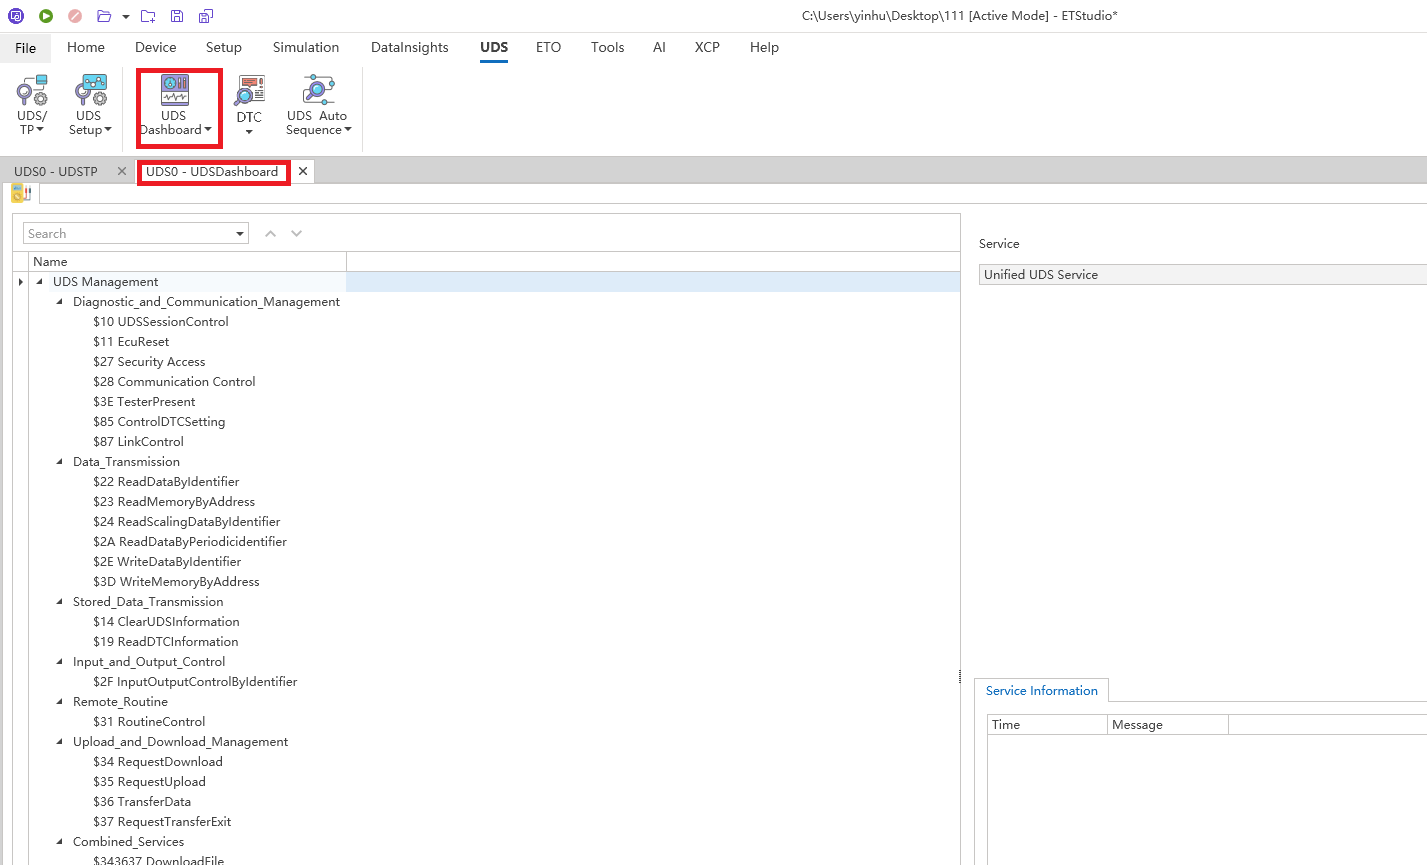
UDS Dashboard Window
The UDS Dashboard window allows you to send a single diagnostic request to the ECU, receive and analyze the diagnostic response returned by the ECU, as shown in the figure.
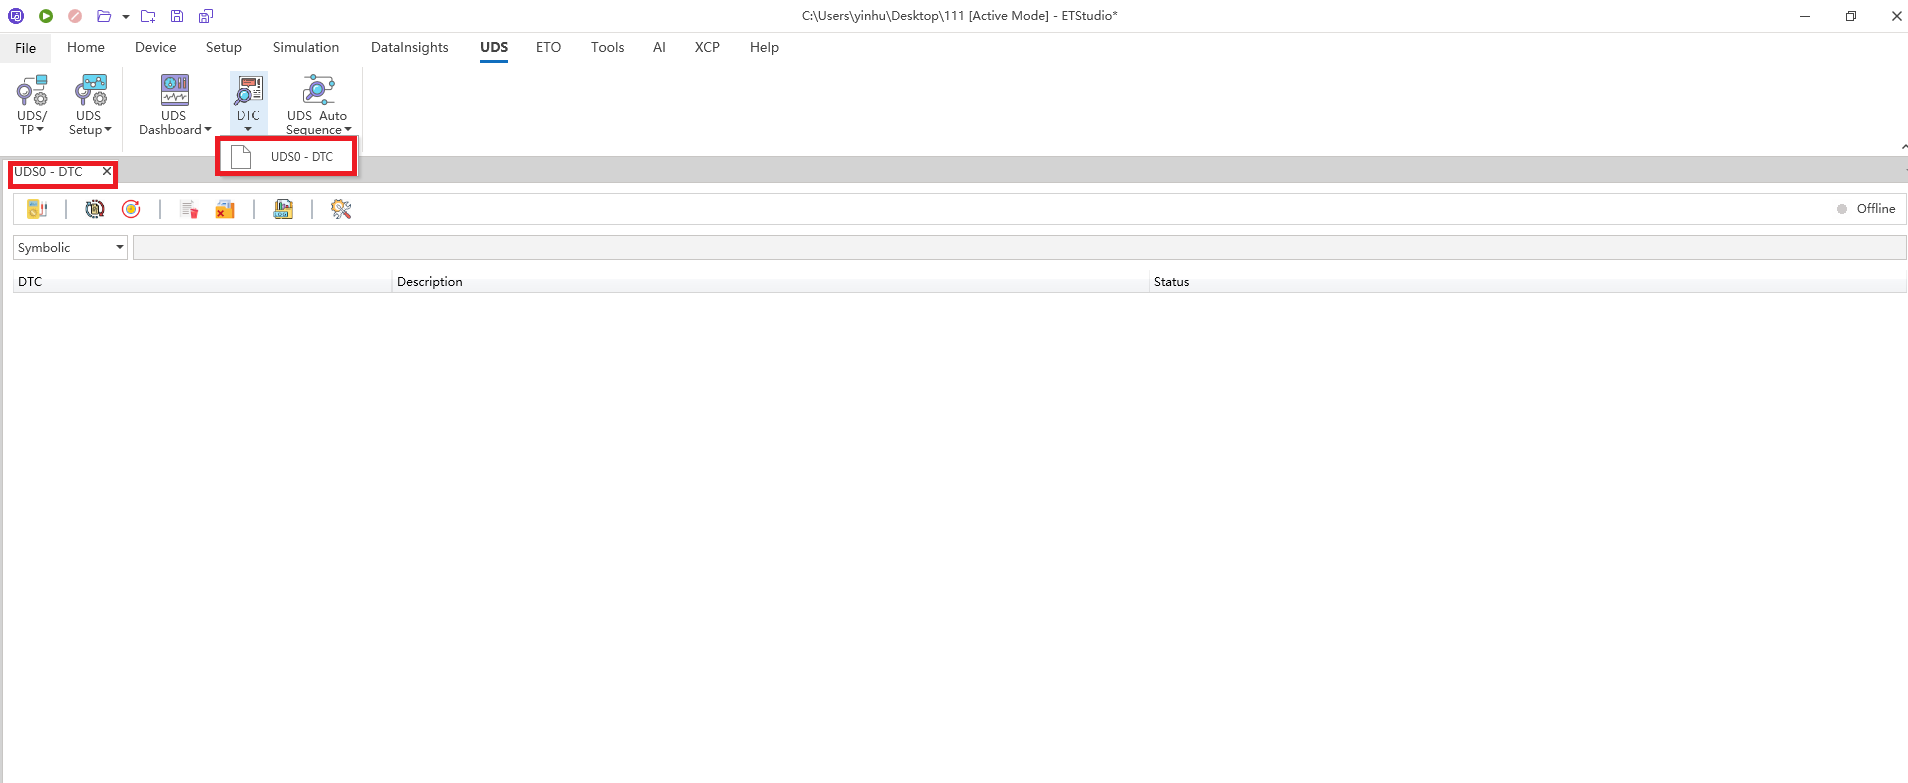
DTC Window The DTC window can read out a list of all DTCs (Diagnostics Trouble Codes) of an ECU, as shown in the figure, and the user can delete the fault codes in the list one by one. In order to read out the DTC list, the relevant diagnostic profile file (e.g. CDD, ODX, or MDX) must be loaded