CAN simulation
Overview of bus simulation engineering
With the development of the times and the advancement of science and technology, the connection between ECU functions on various brands and models has gradually become more complex, and the amount of CAN data that each ECU needs to process is constantly breaking through the upper limit, challenging the data processing capabilities of ECUs. In order to ensure the smooth development and production of each ECU, ETstudio can be used to establish simulation models and evaluate the functions and performance of each ECU. At the same time, the simulation environment established based on ETstudio can realize the simulation of other functional ECUs to detect problems in the development process in advance, accelerate the development and function verification of its own products, and improve the development quality of products.
Bus simulation engineering plays an important role in the process of ECU development, requiring the cooperation of functionaldepartments such as requirements analysis, software development, software testing, environmental testing, hardware verification, production inspection, failure analysis, and customer support. In particular, ECUs with complex functions have quite high requirements for the test environment in the development and testing process, and through the simulation environment, the entire development and testing process can be greatly accelerated.
Bus simulation engineering development process and strategy
In the early stage of ECU module development, it is necessary to analyze and classify product functions to a certain extent in combination with requirements analysis, software development, and software testing to confirm the functional test points and corresponding details that need to be paid attention to in bus simulation. The software development team or software testing team can deploy personnel to carry out the initial development and subsequent maintenance of the bus simulation.
Bus simulation engineering development strategy
Due to the differences between OEMs and products faced by readers in the simulation development process, they need to further analyze the requirements to specify the development strategy in a targeted manner to meet the project needs of simulation engineering. The following are a series of points to note during the simulation project process, which can help create high-quality simulation projects to a certain extent.
-
DBC files are provided by OEMs as much as possible to ensure the accuracy of the database and avoid troubleshooting of data anomalies in self-built databases
-
Do a good job in document analysis and recording of requirements/development: Confirm the requirements of network nodes/packets/functional nodes during simulation preparation, which is conducive to the reasonable preliminary design of the simulation project
-
Actively participate in requirements review/development review/test review, etc.: During the review process, brainstorm to avoid problems such as missing requirements, abnormal development functions, and incomplete test points
-
Timely synchronization of key node changes: Facilitate understanding of the progress stages of the project and access to the latest data sources to add or remove simulation modules
-
Timely follow-up of sample production: replacing simulation nodes with real products can have more accurate simulation results
-
Reasonable construction of simulation project structure:
a. Independent key nodes: can be closed and opened at any time during the project process, more flexible
b. Reusable modules that have little to do with key nodes are centrally processed: avoid a large number of repetitive jobs
c. Add extensible interfaces: Used to expand the functions of possible expansion nodes to improve the plasticity of the project code to a certain extent
-
Make a backup of project configuration: Before and after the ETstudio software update, make a compatibility plan to avoid the project being unavailable before and after the software update
-
The source code of the project is backed up and stored, and the modification records are submitted before the release to avoid subsequent disputes due to program modifications
-
Version control and release documentation with release when the project is released
Bus simulation engineering example
Implement the function
As a simple example, the functions that need to be implemented are mainly interactive, as follows:
- Control operation: Provide a control platform (operation dashboard) to simulate the switching of the power supply, as well as temporary pause, resume functions.
- Data display: The main body of the instrument receives the message data from the bus, performs subsequent data processing, and displays the timing countdown and traffic light effect.
- Data interaction: Code programming to adapt to the corresponding data processing logic.
- Data analysis: Add Timeline Timeline Trace and Diagram windows for data analysis.
Project realization
Simulation project creation
Open ETStudio software, select File→New, select CAN_playback from the optional templates, and double-click to select the folder location that needs to be stored in the pop-up dialog box (folder and folder path do not contain Chinese). You can create an empty project that initially contains CAN, and create directories such as DBC, dashboard, Code, and Header in the project folder as needed to facilitate subsequent content management.
DBC file import
In the simulation engineering development strategy, it is mentioned that in the development process, the automaker generally provides a complete and reliable DBC file, and the probability of creating a DBC by itself is very small, It only needs to be imported.
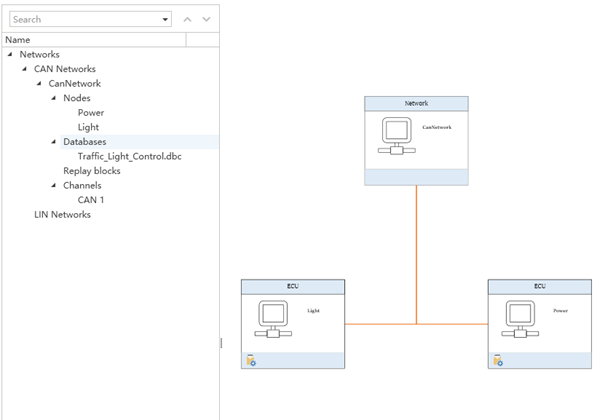
Then import the created DBC into the created simulation project, and finally get the topology diagram in the Simulation Setup window as follows:
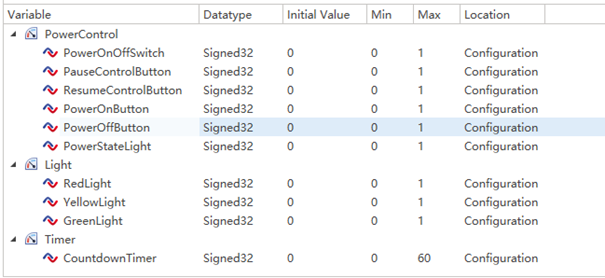
System variables
Select Setup→Global Variables in the menu bar to open the system variable addition interface, add system variables as needed, and create different namespaces to distinguish the scope of different system variables for easy management and use.
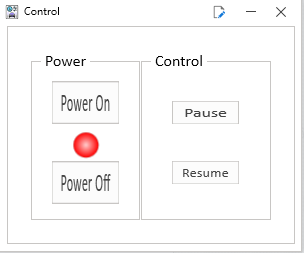
Dashboard design
In this example, two dashboards are used, one for simulating power control operations and one for receiving and processing related signals and then displaying traffic lights.
Power_Control:
Traffic_Light:

C applet code implementation
# PowerControl.cpp
#include "LightControl.h"

void On_SysVar_PowerOn()
{
    show_console_message("On_SysVar_PowerOn   111");
    if(PowerControl::PowerOnButton)
    {
        CanNetwork::PowerControl  msg;
        msg.TrafficPowerState = 1;
        msg.TrafficLightRunningState =1;
        msg.Transmit();
        start_timer(100,true,On_Light_Count_Down_Timer);
    }
}

void On_SysVar_PowerOff()
{
    show_console_message("On_SysVar_PowerOff   111");
    if(PowerControl::PowerOffButton)
    {
        CanNetwork::PowerControl  msg;
        msg.TrafficPowerState =0;
        msg.TrafficLightRunningState =4;
        msg.Transmit();
    }
}

void On_SysVar_PauseControlButton()
{
    if(PowerControl::PauseControlButton == 1  and powerState == 1)
    {
        CanNetwork::PowerControl  msg;
        msg.TrafficPowerState =0;
        msg.TrafficLightRunningState =2;
        msg.Transmit();
    }
}

void On_SysVar_ResumeControlButton()
{

    if(PowerControl::ResumeControlButton == 1 and powerState == 1)
    {
        CanNetwork::PowerControl  msg;
        msg.TrafficPowerState =0;
        msg.TrafficLightRunningState =3;
        msg.Transmit();
        start_timer(100,true,On_Light_Count_Down_Timer);
    }
}

void On_Message_PowerControl(CanNetwork::PowerControl *msg)
{
    show_console_message("recevice");
    powerState = msg->TrafficPowerState;
    runningmode = msg->TrafficLightRunningState;
}

void recived(EM_ReceiveFrame_t const *msg)
{
    show_console_message("read");
}
void PreviewApplicationInitialize()
{

}

void OnStart()
{
    PowerControl::PowerOnButton.SetOnChange(On_SysVar_PowerOn);
    PowerControl::PowerOffButton.SetOnChange(On_SysVar_PowerOff);
    PowerControl::PauseControlButton.SetOnChange(On_SysVar_PauseControlButton);
    PowerControl::ResumeControlButton.SetOnChange(On_SysVar_ResumeControlButton);
    CanNetwork::TrafficLight::OnMessage = On_Message_TrafficLightBrtState;
    CanNetwork::TrafficTimer::OnMessage = On_Message_TrafficTimerTimeout;
    CanNetwork::PowerControl::OnMessage = On_Message_PowerControl;
}

void OnExit()
{
}
#LightControl.cpp
#include "LightControl.h"
int sec = 0;

void On_Light_Count_Down_Timer(void* timer)
{
    show_console_message("On_Light_Count_Down_Timer");
    show_console_message("");
    if(powerState == 0 ||powerState == 4)
    {
        CanNetwork_291_TrafficLight::TrafficLightBrtState = 0;
        sec = 0;
        return;
    }
    if(powerState == 2)
    {
        return;
    }
    if(sec == 0)
    {
        CanNetwork_561_TrafficTimer::TrafficTimerTimeout = 1;
    }
    else{
        Timer::CountdownTimer = sec;
        sec -- ;
        start_timer(1000,true,On_Light_Count_Down_Timer);

    }
}

void On_Message_TrafficLightBrtState(CanNetwork::TrafficLight *msg)
{
    if (CanNetwork_291_TrafficLight::TrafficLightBrtState == 0)
        return;
    if(CanNetwork_291_TrafficLight::TrafficLightBrtState == 1)
    {
        sec = 45;
    }
    else if(CanNetwork_291_TrafficLight::TrafficLightBrtState == 2)
    {
        sec = 3;
    }
    else if(CanNetwork_291_TrafficLight::TrafficLightBrtState == 3)
    {
        sec = 30;
    }
    start_timer(1000,true,On_Light_Count_Down_Timer);
}

void On_Message_TrafficTimerTimeout(CanNetwork::TrafficTimer *msg)
{
    if(CanNetwork_561_TrafficTimer::TrafficTimerTimeout)
    {
        int light_state = CanNetwork_291_TrafficLight::TrafficLightBrtState;
        CanNetwork_291_TrafficLight::TrafficLightBrtState = light_state % 3 + 1;
        CanNetwork_561_TrafficTimer::TrafficTimerTimeout = 0;
    }
}
#LightControl.h
#ifndef __LIGHTCONTROL__HH__
#define __LIGHTCONTROL__HH__
#include "BaseMiniProgram.h"
#include <iostream>
using namespace std;

void On_Message_TrafficTimerTimeout(CanNetwork::TrafficTimer *msg);
void On_Message_TrafficLightBrtState(CanNetwork::TrafficLight *msg);
void On_Light_Count_Down_Timer(void* timer);

static int powerState =0;
static int runningmode =  0;

#endif
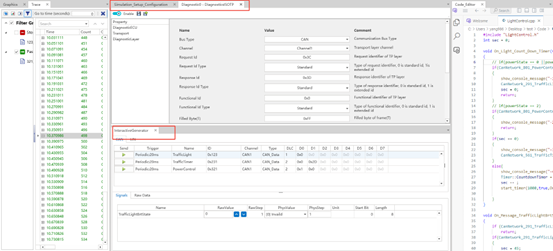
Analysis window settings
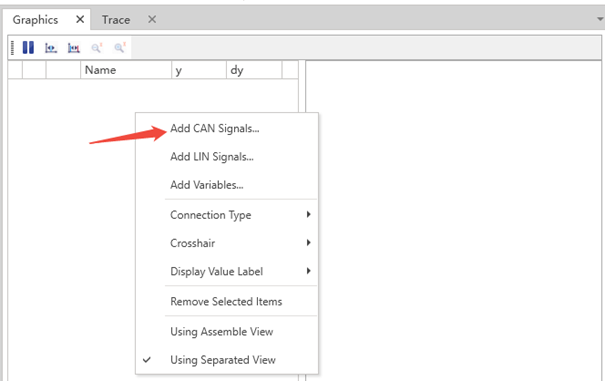
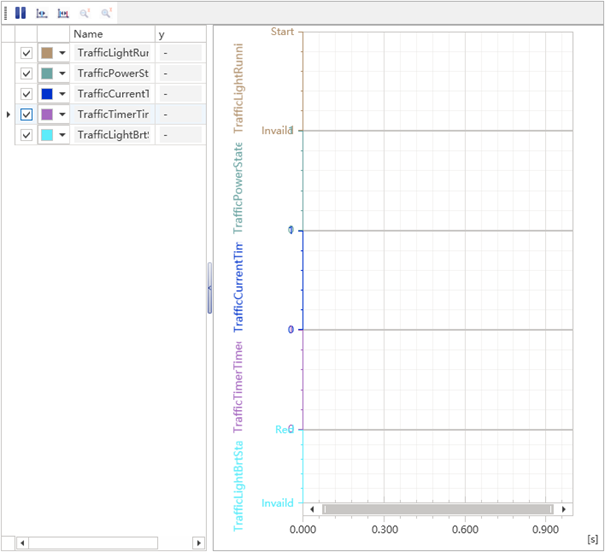
Select Datalnsights→Diagram in the ETStudio menu bar to bring up the Diagram window, right-click on the left side of the pop-up window and select Add Can Signals, and select the can signal you want to observe. By checking the box, determine how many CAN signals need to be displayed at the same time.
Timeline Trace window and Logging
Both the Timeline Trace window and the logging function are very important in the simulation project. The Timeline Trace window provides the ability to view and analyze the data on the bus in real time, and can locate problems more quickly and intuitively during the simulation process, confirm whether the signal transmission and reception at each stage conform to the actual actions of the simulation, and accurately reach the signal and time point through filters. The logging function records the signal data of the entire simulation process, and in the case of a large amount of data or long-term testing, the retained log data can be provided to users for offline data analysis, which is convenient for reproducing problems on the bus and helping to locate the cause of the problem.
In ETStudio, select Diagram→Timeline Trace in the menu bar to pop up the Timeline Trace window, after the simulation starts, the signal will appear in the right window, at this time, you can drag the message message to be monitored/filtered to the corresponding filter, click Filter Group to complete the filtering of the message message, and then confirm the problem according to the required time point.
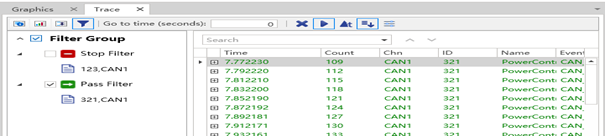
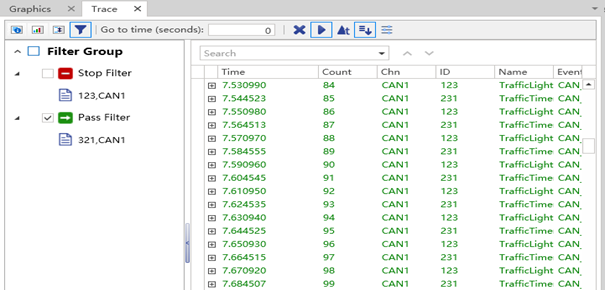
The above is a comparison of the effectiveness of the filter. You can also right-click on the right window and select clear/resume and the Logging file import and export action.
Desktop layout
In the development process of ETStudio simulation projects, it is often not achieved overnight, and the project itself often needs to be edited frequently. Therefore, a reasonable desktop layout can better help the construction of functions within a certain project cycle, as well as the readability after the package project is delivered.
Strictly speaking, ETStudio does not have an intuitive window layout, but provides a freely draggable layout:
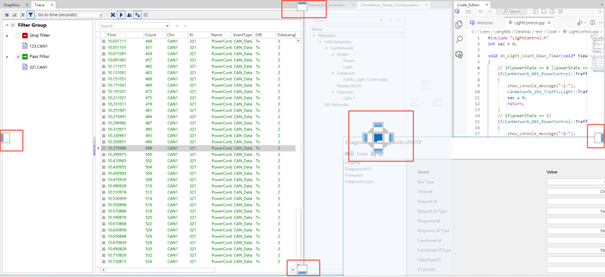
As shown in the image above, the layout can be achieved by dragging the window, mainly distinguishing it in:
- tab pagination within the same layout range
In the above figure, the Timeline Trace and Diagram windows are divided into the same module, and the Diagnostic configuration window and the Simulation Setup window are merged, which can be used as a reference method for layout. - Main window layout up and down, left and right
According to personal operating habits, the main window interface is divided into left/right/up and down, which is more readable. - Module layout in the middle of the module
For the function window in the module, you can choose to pull down or increase the important content separately, as shown in the figure