Dashboard design environment introduction
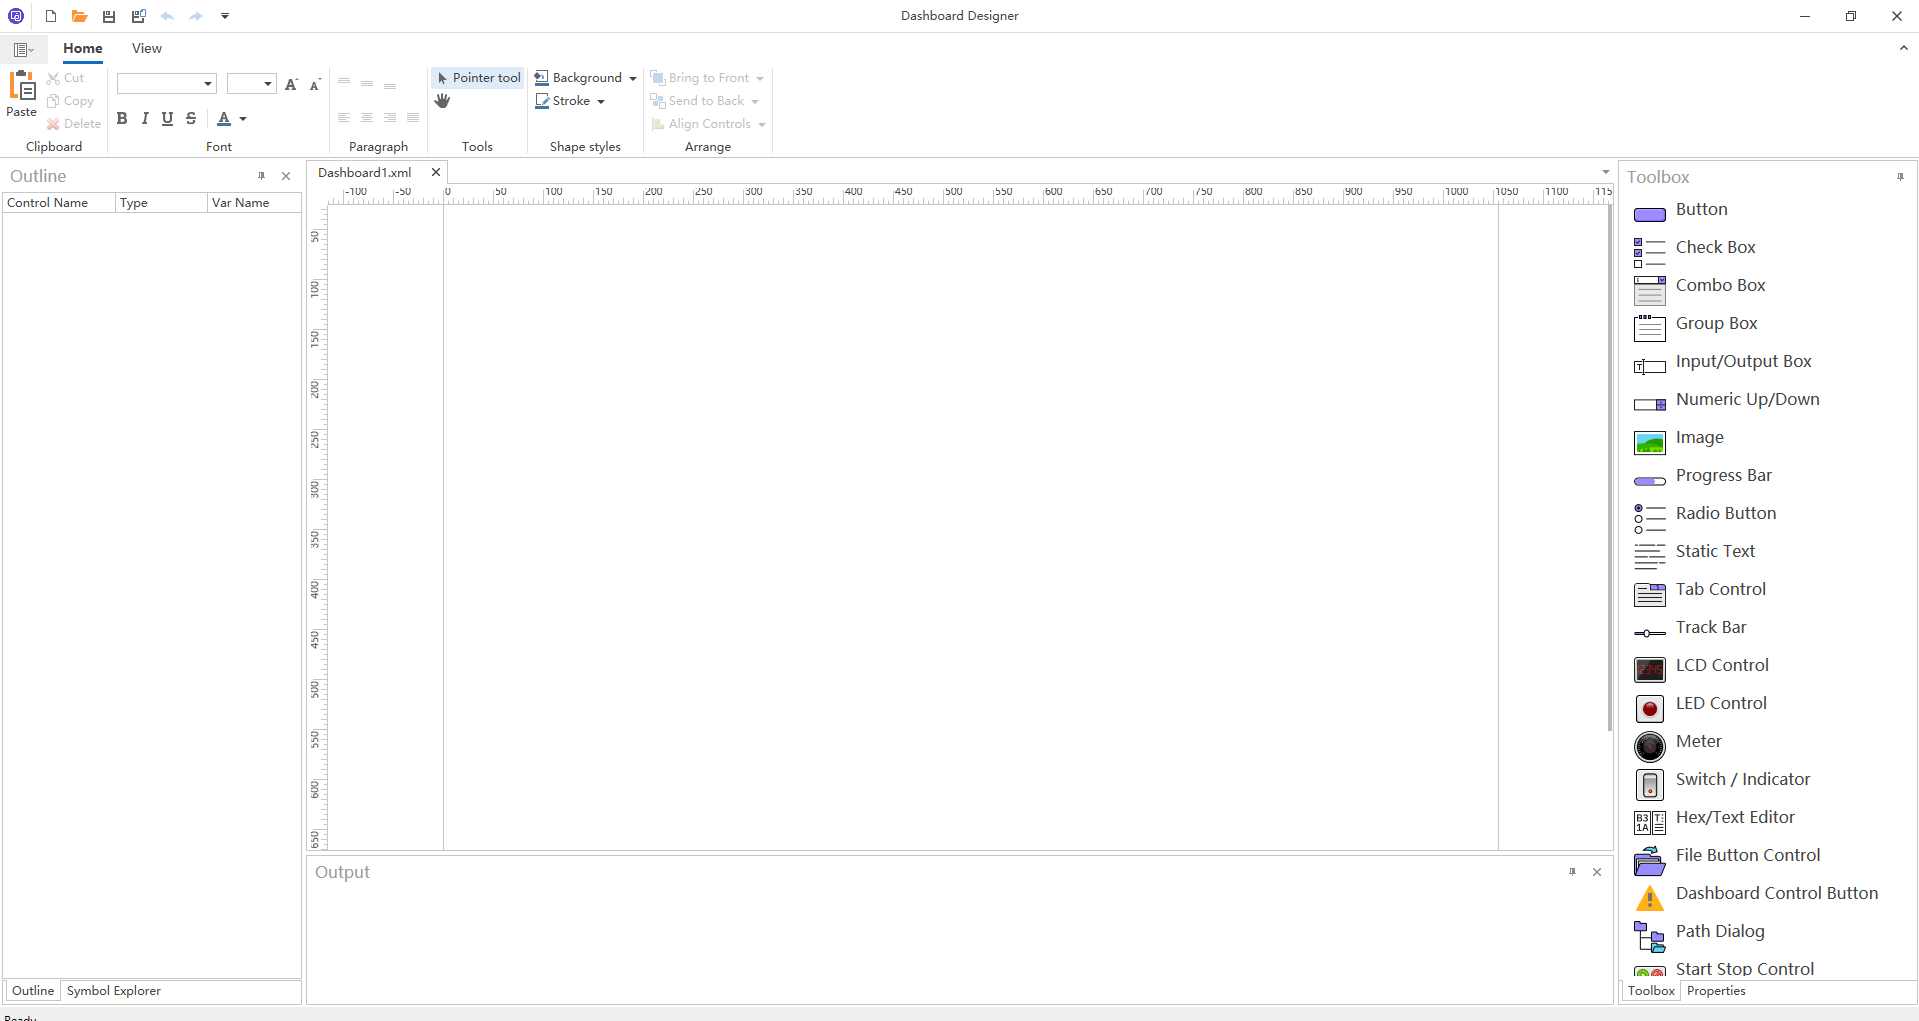
Figure shows the development environment designed by Dashboard, users can enter this design interface through Home→Dashboard→New Dashboard→ Dashboard Designer (Dashboard Editor) in the main interface of ET Studio. Let's first introduce the ribbon and main windows in the Dashboard design interface.
File menu
Table describes the icons and functions of the File menu of Dashboard Designer, which mainly provides functions such as Dashboard file operation and settings.
Home ribbon area
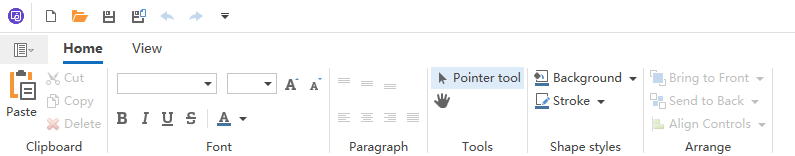
The Home ribbon provides some common operations for Dashboard design, such as copying, cutting, and pasting controls, as well as adjusting the size and position of controls, as shown in Figure.

Dashboard ribbon area
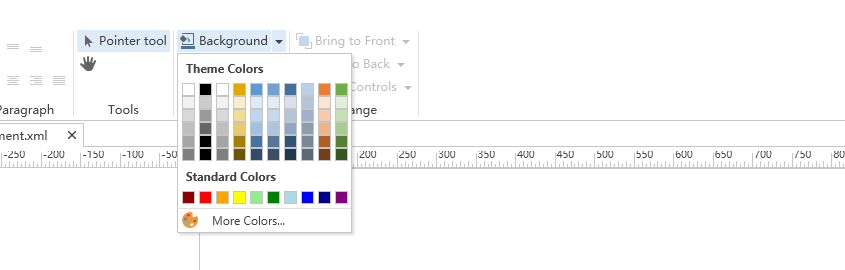
The Dashboard ribbon provides the ability to modify Dashboard properties, allowing users to adjust the Dashboard's size, background color, or image, as shown in Figure.
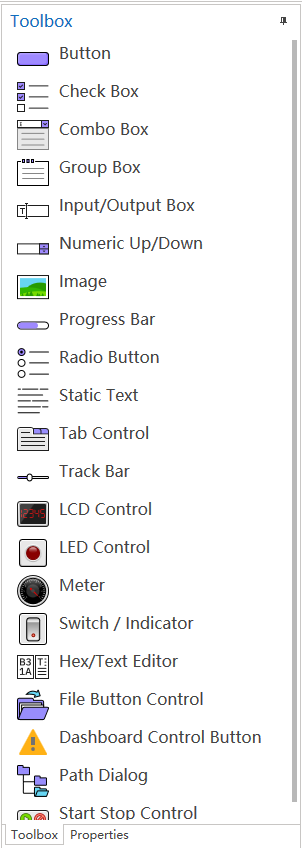
Toolbox window
The Toolbox window displays all currently available controls, which can be dragged by holding down the left mouse button or double-clicking on the currently edited Dashboard.
The Outline View window
The Outline window provides a comprehensive view of all the controls on the current canvas and their associated signals or variables.

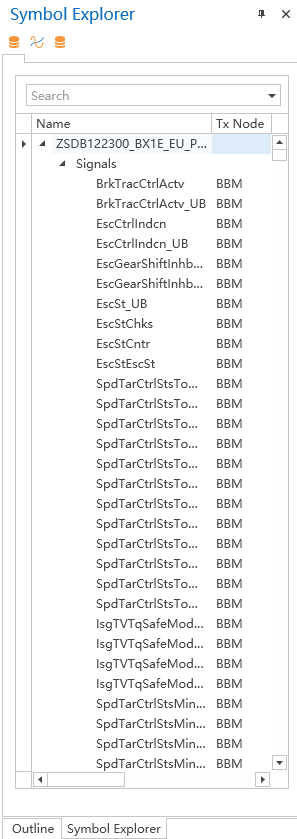
Symbol Explorer window
The Symbol Explorer displays all currently available objects (such as signals, system variables, and environment variables), as shown in Figure. Users can drag and drop with the left mouse button to associate it with a control in the currently edited Dashboard.
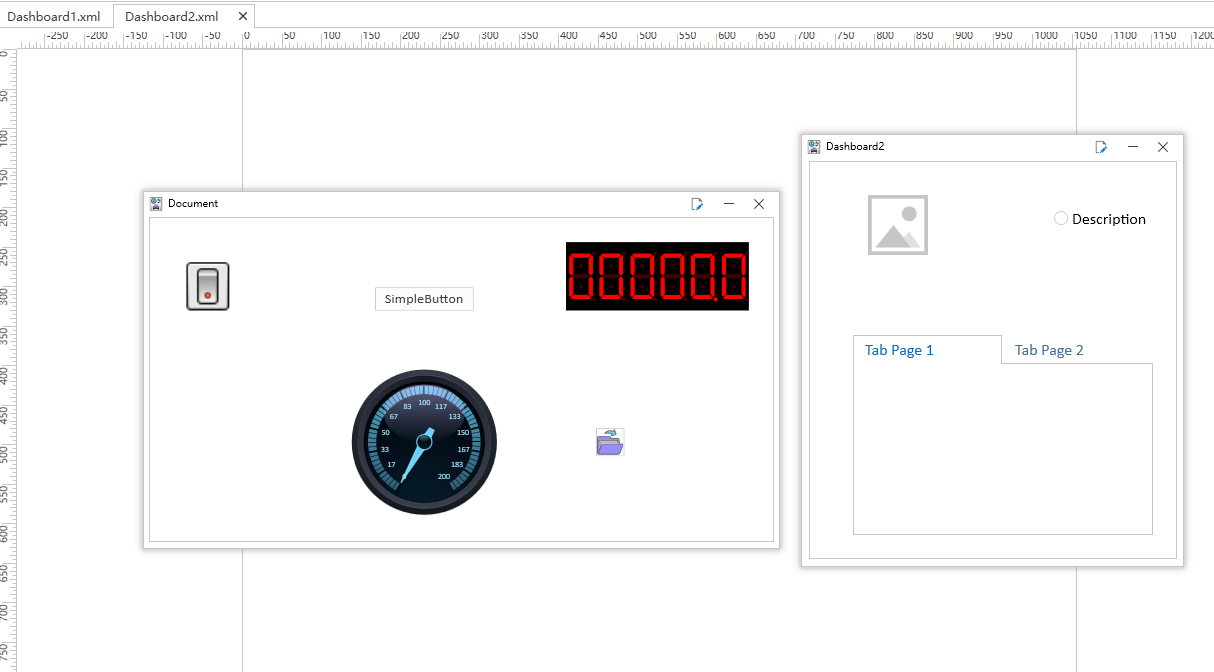
Working Area window
The Working Area window can be edited by Dashboards. When creating or opening multiple Dashboards, the top of the workspace displays the names of all open Dashboards, as shown in Figure.
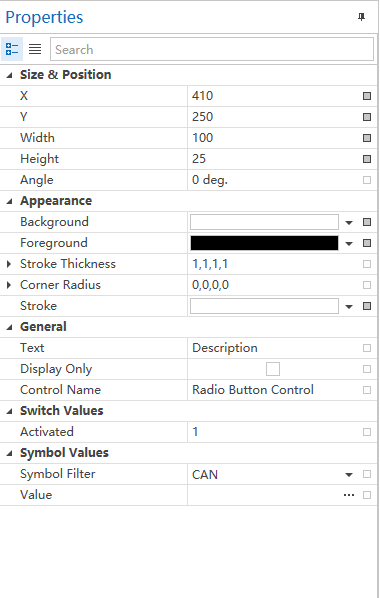
Properties window
The Properties window lists all the properties that are editable by the currently selected control, and a short description of the current property is displayed at the bottom to help the user understand the definition of the property, as shown in Figure.

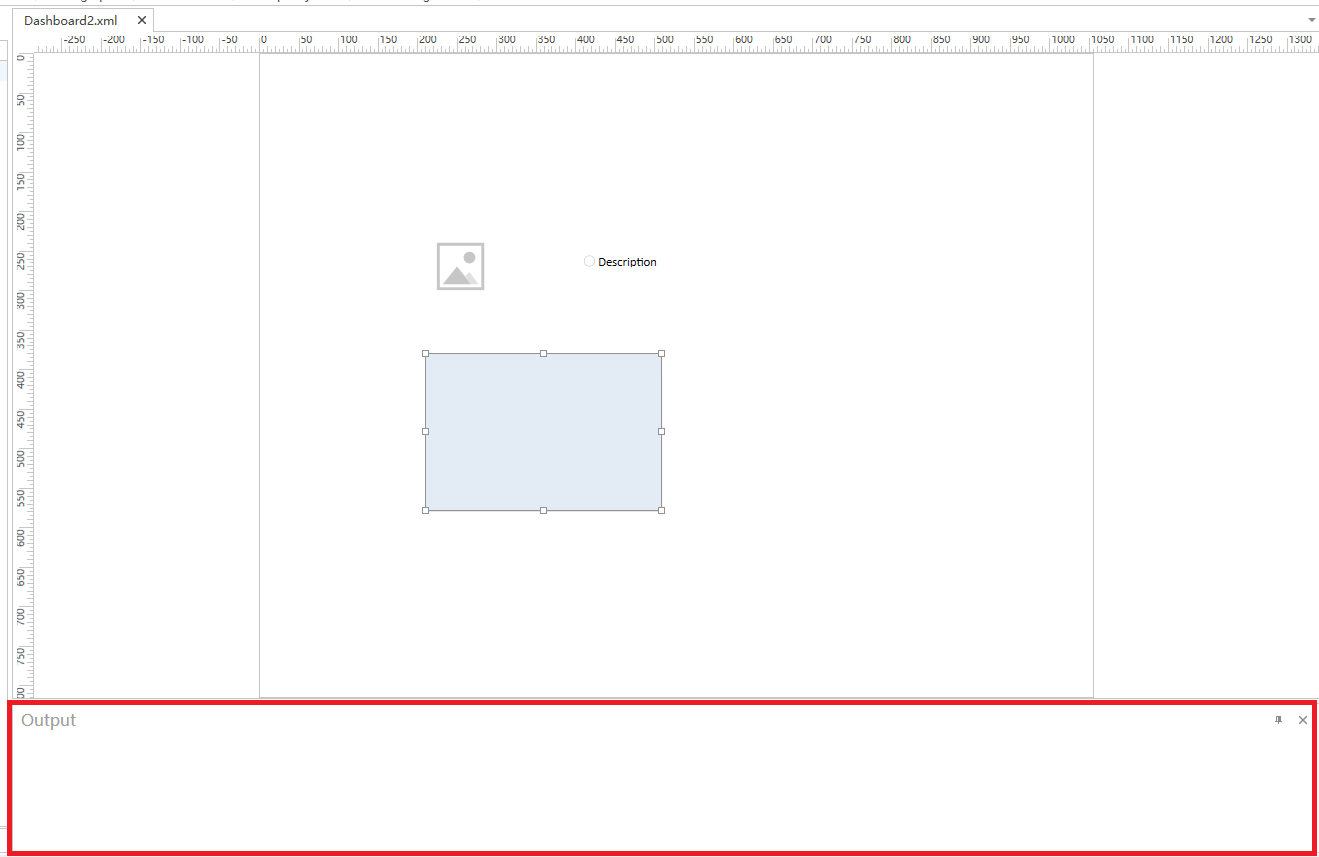
Output Window
The Output Window is used to display error or warning messages for controls in the current edit Dashboard.