ETStudio Diagnostics
ETStudio's diagnostic module provides a powerful diagnostic console that enables users to fully customize transmission (Tx) and response (Rx) requests for vehicle communication. This guide details the parameters that ensure optimal diagnostic performance by configuring the transport layer, service layer, and security access (seed and key).
Diagnostic profile
To take full advantage of ETStudio's diagnostic functions, you need to import the Diagnostic Description into your ETStudio simulation project. ETStudio often refers to diagnostic criteria documents as "diagnostic instructions," which is also used here to avoid confusion. For simpler diagnostic instructions, users can use ETStudio's built-in "DiagnosticsISOTP".
Diagnostic test window
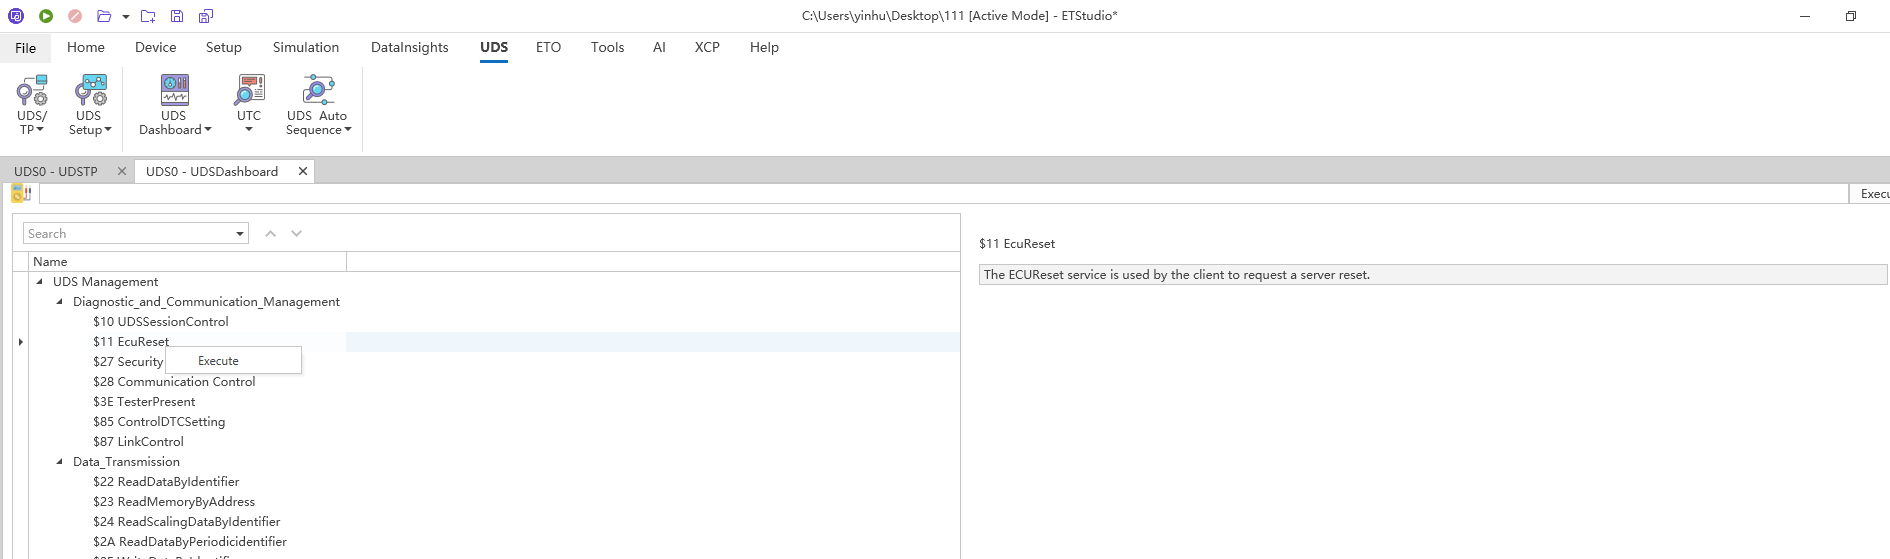
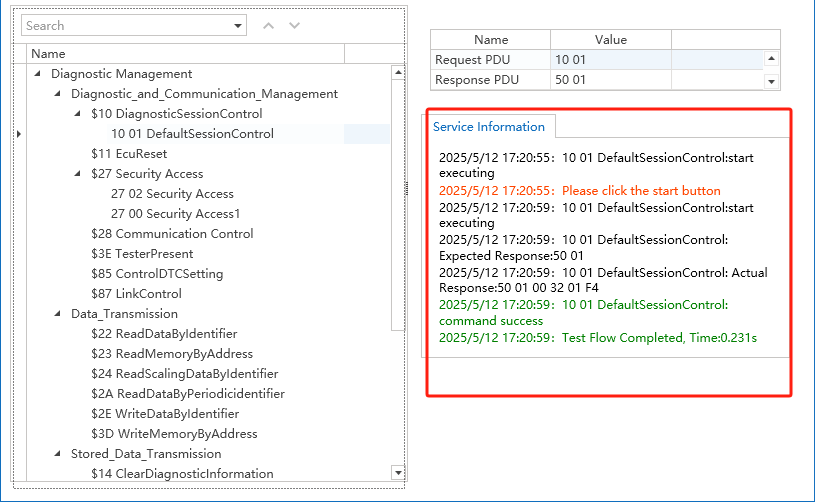
To perform the default session:
-
Click Start
-
Right-click on 10 01 Excute to execute the default session
-
The response is displayed in the Response column
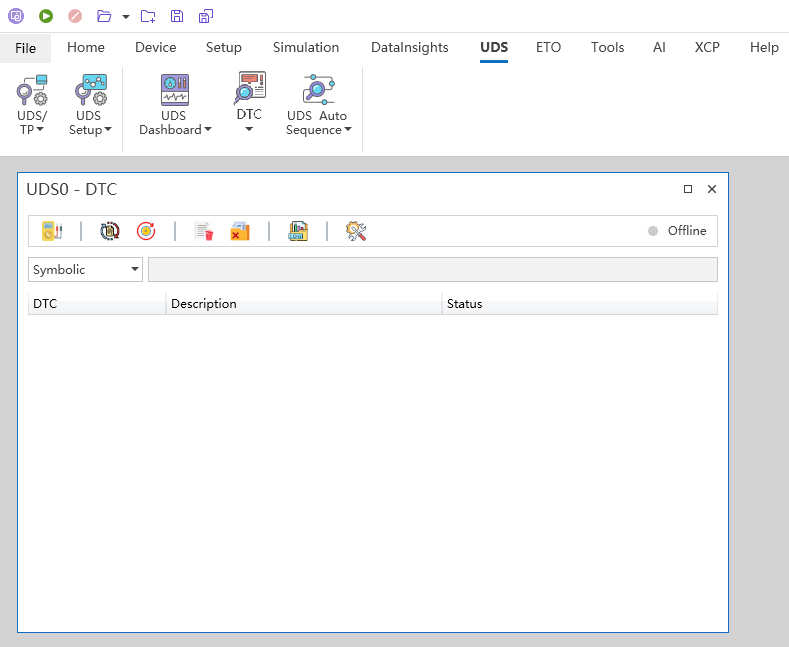
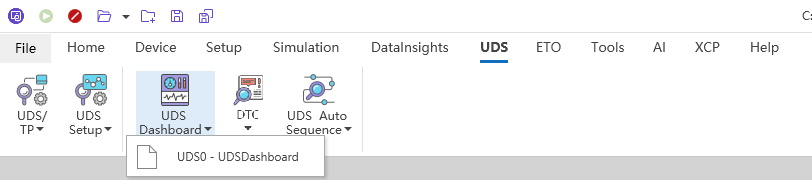
DTC Viewer
The ECU contains a dedicated storage area for fault diagnosis codes (DTCs) and associated fault logs. All detected anomalous events (e.g., sensor breaks, signal anomalies, ECU self-test errors) are recorded in this fault memory for use by after-sales, test, and development teams.
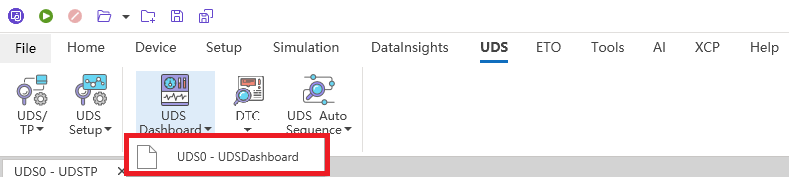
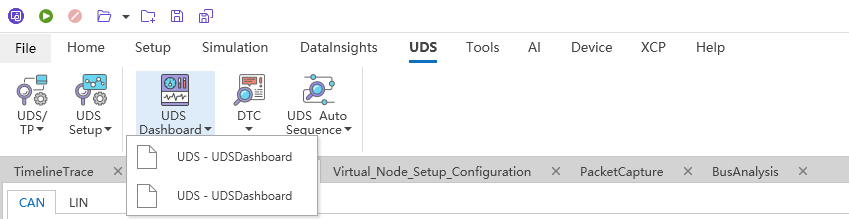
- Action: Click UDS ->DTC
Tester on/off (session keep-alive mechanism)
- Function: The detector presence service (0x3E) maintains an active diagnostic session and prevents timeouts. ECUs (e.g., 0x03, 0x02) in the extension/programming session will automatically revert to the default session and terminate the high-privilege operation to receive requests within the timeout period (e.g., 5000ms or 10000ms) if there is no diagnosis.
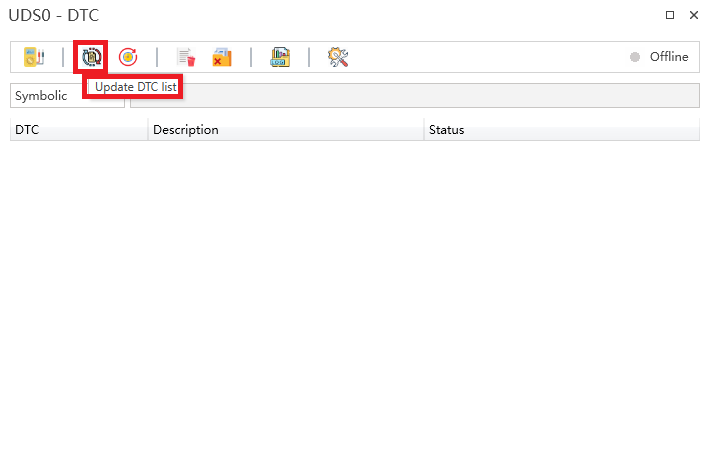
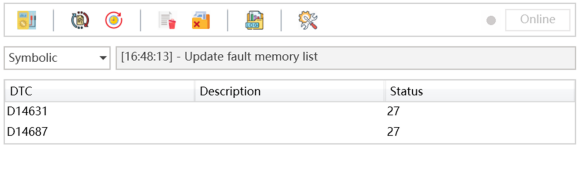
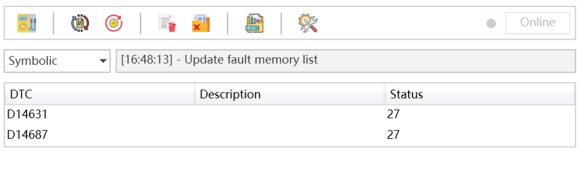
Updating the Fault Memory List (0x19 Service)
-
Function: Force the ECU to re-perform the current fault snapshot detection, update the DTC status, and refresh the internal fault list.
-
Result: DTC will fill out the form.
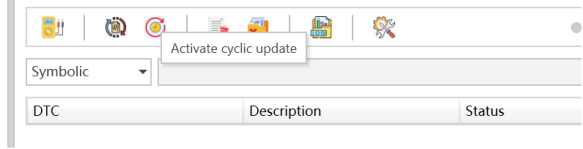
Activate recurring updates (0x19 service)
-
Function: Schedule to repeat and send services 19 and refresh the internal fault list.
-
Result: DTC will fill out the form.
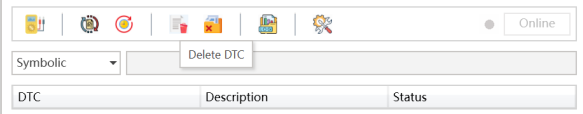
Delete DTC (0x14 service)
-
Function: Clear the specified DTC record stored in the ECU. When an anomaly is detected (e.g., sensor disconnected, signal error), the ECU records it as a DTC in the fault memory.
-
Operation: Select a DTC and click Delete to remove it from the ECU.
-
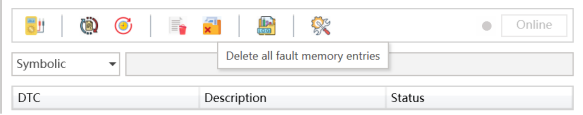
Function: Clear all DTC records in the ECU and reset the fault memory to the initial state.
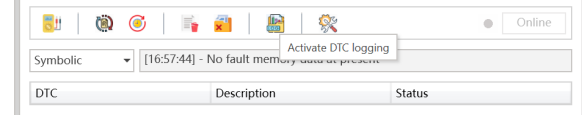
Activate DTC records
- Function: Save DTC records to local files. Default log path: ETStudio installation directory. Custom paths can be configured through the Properties page.
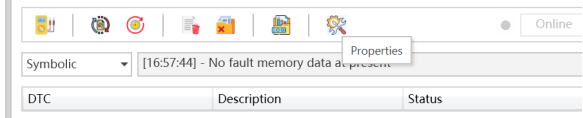
Property configuration page
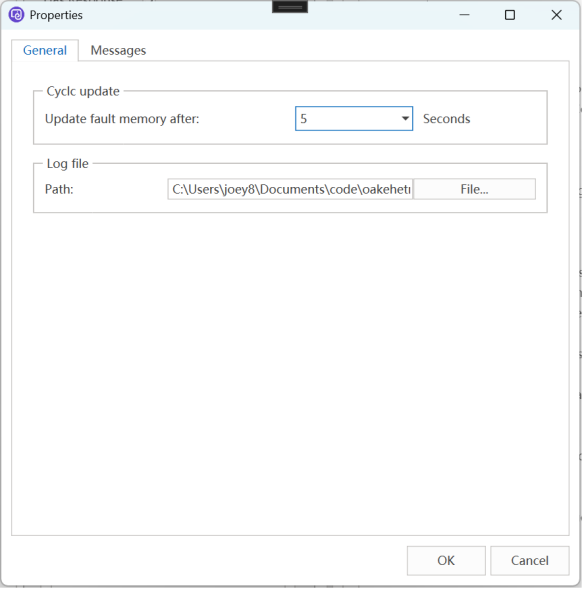
General Tab
-
Update fault memory interval: Default: 5 seconds. Configure the recurring update interval.
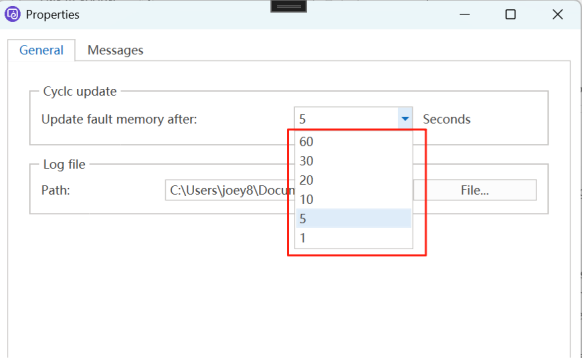
-
Log file path: Modify the DTC log storage path.
Message Tab
-
PDU Configuration: View or modify protocol data unit (PDU) specific services that contain the following protocol control information.
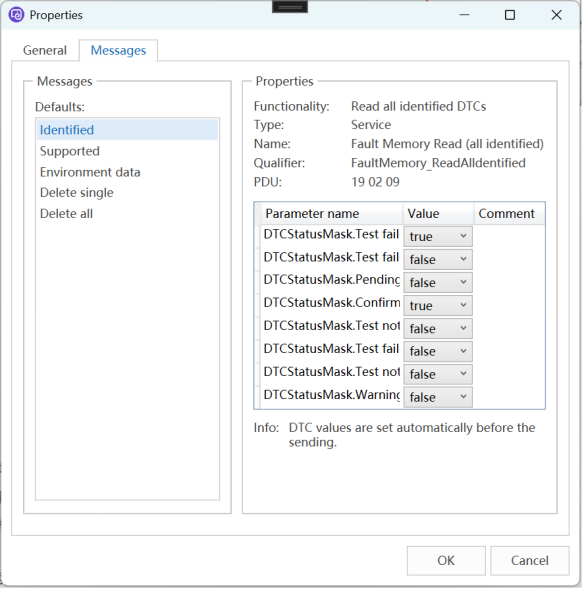
-
Action: Click the item in the left menu to edit or view the PDU for the corresponding service.
Session Control
- Specifically for switching the current session state of the ECU. Click on menu UDS --> UDS Setup.
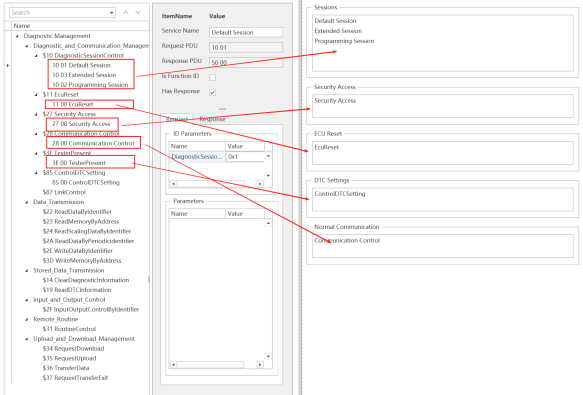
On the ETStudio Basic Diagnostic Configuration page, all the configured session control services will appear on the session control page. Select the specified service, and then double-click to execute the service. For example, to perform an extended session, simply double-click on the extended session.
Project realization
Security DLL file configuration
Load external seeds and key DLLs During the diagnostic process, issues related to secure access, known as seeds and keys, include encounters. The ETStudio diagnostic module supports loading seed and key algorithms through DLLs that are compatible with the compute interfaces of mainstream tools.
Diagnostic Console
The diagnostic console acts as a diagnostic command debugger, providing users with the ability to select and execute individual service commands to receive and analyze response messages for testing and validating the execution of preconfigured services (for example, default session, extended session).
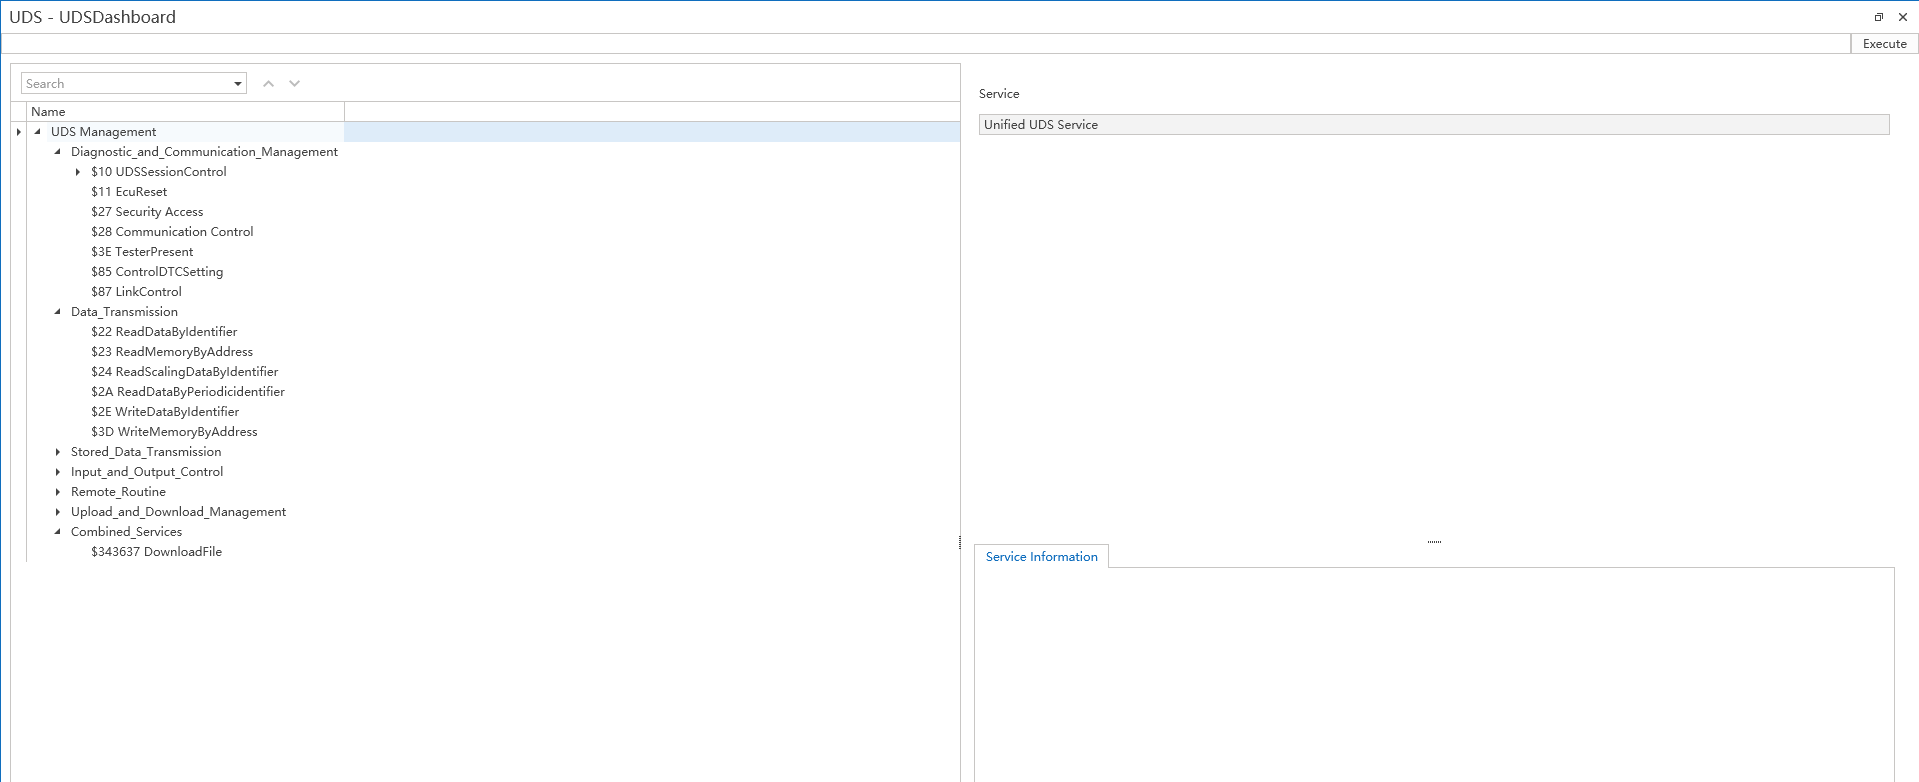
The list of diagnostic requests on the left shows all the diagnostic service requests defined in the current CDD file. Users can trigger a service request by double-clicking on it and view the response results for that request in the Diagnostic Response Results area. If a diagnostic service request involves a write operation, the user can enter the parameter values that need to be written in the diagnostic request settings area, and then execute the request.
Diagnostic test dashboard
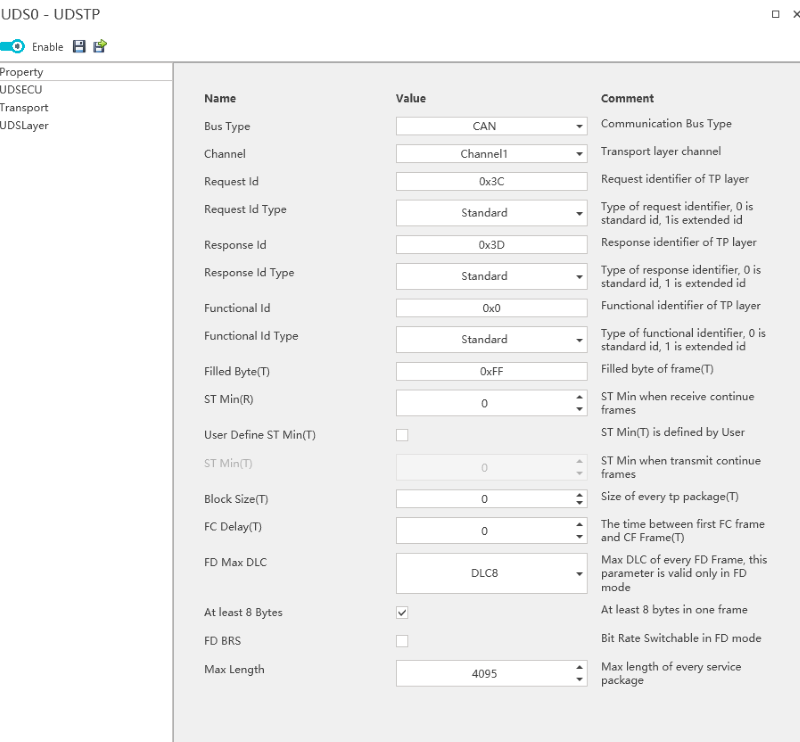
Transport layer configuration
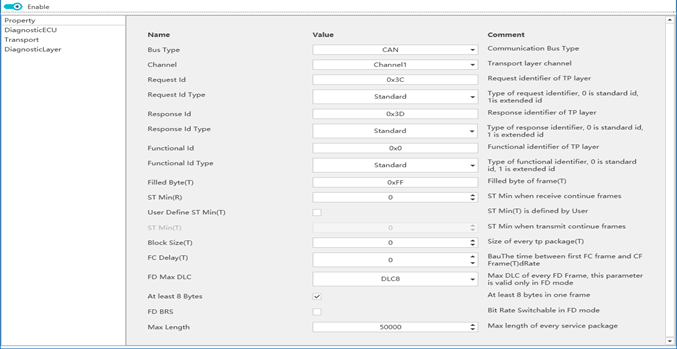
Each parameter is explained as follows:
-
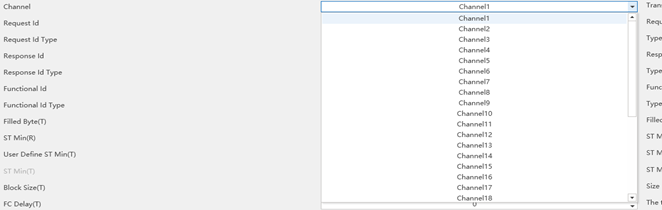
Bus Type: Diagnoses the transport layer type, currently supports CAN/CANFD. Users can select from the drop-down list as shown in the image below:

-
Bus Type: Diagnoses the transport layer type, currently supports CAN/CANFD. Users can select from the drop-down list as shown in the image below:
-
Set the ID of the diagnostic request, response, and function frame on the PC tool side of the diagnostic module.
-
Request Id Type/Response Id Type/Function Id Type: Set the Id type of the diagnostic request, response, and function frame on the PC tool side of the diagnostic module, whether it is a standard frame (11 bits) or an extended frame (29 bits), as shown in the following figure:

-
Filled Byte: During transmission, when the actual effective bytes are less than the CAN message data frame, the remaining data segments will be filled with bytes. For example, if the length of a CAN message frame is 8 bytes, the effective transmission bytes are 0x02, 0x10, 0x02, and the fill bytes are 0xAA, then the actual message bytes are 0x000002, 0x10, 0x02, 0xFA, 0xAA, 0xAA].
-
ST min: The shortest reception interval. When ETStudio's diagnostic module acts as the receiver, it supports receiving consecutive frame messages at the minimum interval between diagnostic frames. This parameter is the response customer to the diagnosis. Setting it to 0 means that it supports receiving at the shortest possible interval.
-
Block Size: The size of the block received. When ETStudio's diagnostic module receives a continuous frame message as the receiver, it indicates the size of the data in chunks that can be received at a time. This parameter is for diagnostic clients. Setting it to 0 means it can receive blocks of any size at a time.
-
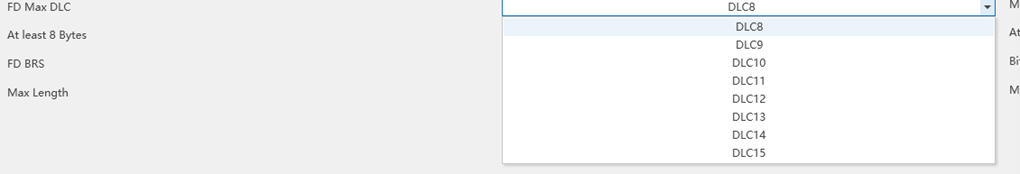
FD Max DLC: When the transport layer is set to CAN FD, the maximum number of bytes that can be transferred in a single frame is 64 bytes (DLC=15), but this parameter is adjustable, and the adjustment range is as shown in the figure below:
-
Max Length: This parameter has no meaning for standard CAN/LIN. When transmitting during multiframes, when the DLC is 8 bytes long, the first frame uses byte 0
-
The first byte of 8 bits, 12 bits in total, represents the size of a single packet transfer, up to 4095 bytes, as shown in the image below:
Service tier configuration
Control diagnostic session timing and ECU response behavior.
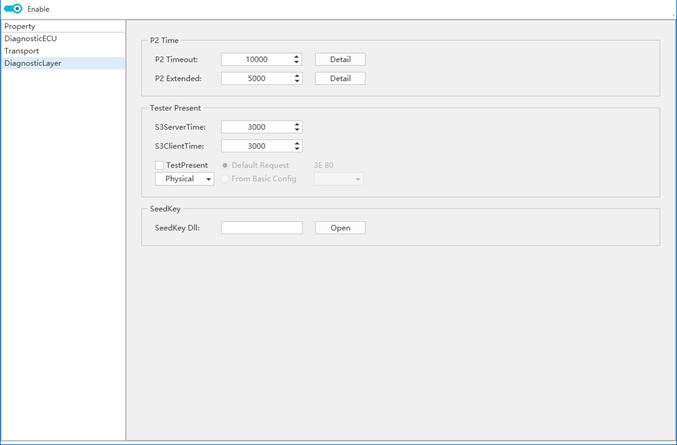
S3 Server Time: The timeout before the ECU reverts to the default session.
S3 Client Time: Sends TesterPresent(0x3E) to maintain the interval between session activity. Click the View Schematic Details button for the above two parameters.
P2 Timeout: Indicates the minimum time interval for the diagnostic request frame that the ECU must reply. For the diagnostic tool, this parameter can be used as a judgment parameter after sending a request after the timeout. For example, if the diagnostic tool sends a diagnostic message that does not receive a reply within the P2Timeout time period, the request is considered to have failed and the process exits due to a timeout.
P2 Extension: When the diagnostic tool sends a diagnostic message, if the ECU under test does not have enough time to respond within the P2 timeout, it will reply with 7F XX 78 to notify the diagnostic tool that it cannot respond in time and needs to wait a while before replying. After the ECU sends a delay wait message, the wait time parameter switches to P2Extended. After receiving a delay wait message, the timeout judgment parameter of the diagnostic tool needs to be switched to P2Extended.
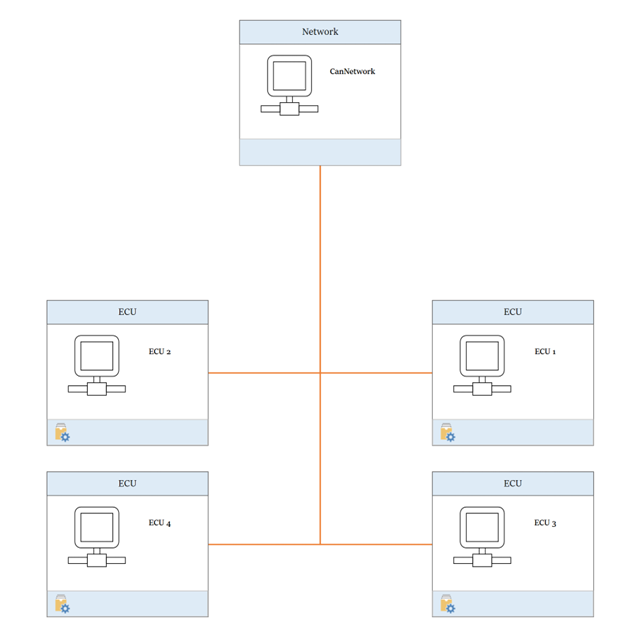
Add a Tester node
Virtual diagnostic response
Automatic Diagnostics Process
ETStudio's automated diagnostic process is designed to simplify and manage diagnostic operations, not just for individual applications, but for the entire project lifecycle. Users can fully customize the diagnostic testing workflow to match the specific requirements of the project. The system provides an intuitive interface for configuring, executing, and monitoring diagnostic processes, ensuring efficiency and accuracy.
To access the workflow case management menu, simply right-click on the UDS Process Management Bar. This will display a list of available actions as follows:
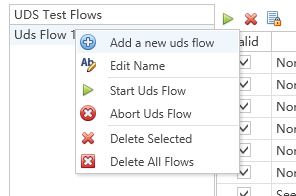
The main business includes:
- Add New Uds Flow: Create a new diagnostic process case under which the user can define And organize detailed diagnostic steps.
- Edit Name: Select an existing process case, right-click, and select "Edit Name" to modify the node's label for clarity and organization.
- Start Uds Flow: Initiate the diagnostic process for the selected node. The system will automatically execute the settings on the right dashboard for each diagnostic step based on the pre-configured sequence.
- Abort Uds Flow: After clicking this node, the interrupt diagnostic process step is currently being executed.
- Delete Selected: Deletes the selected node.
- Delete all flows: Clear all nodes.
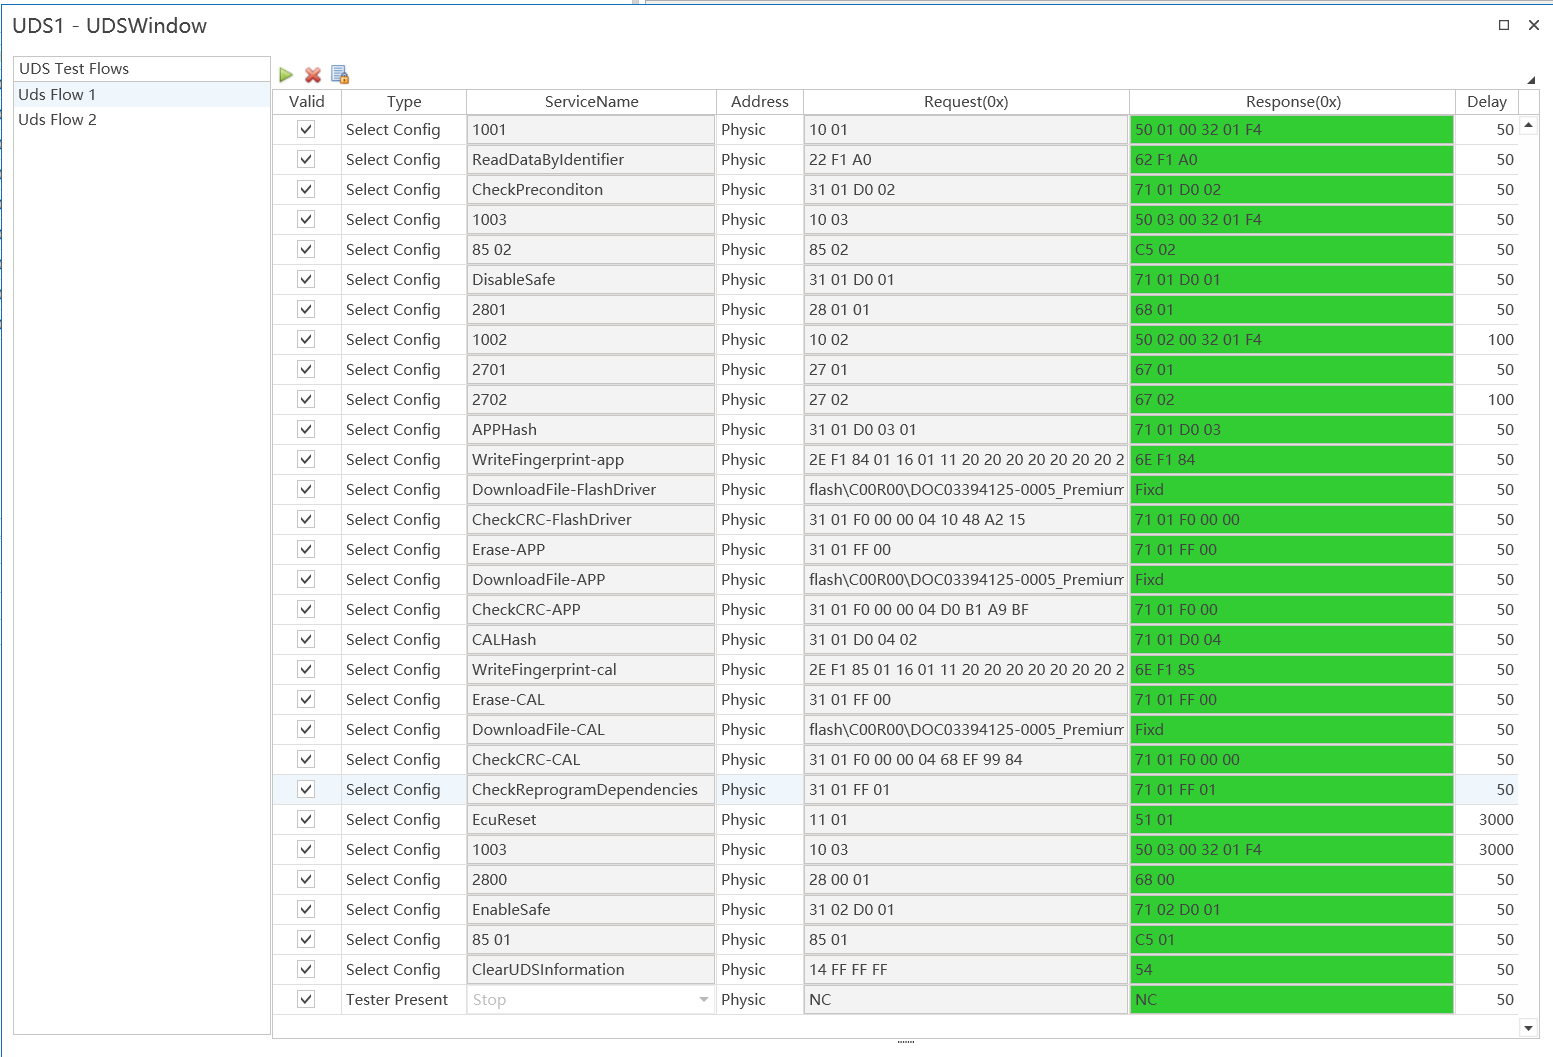
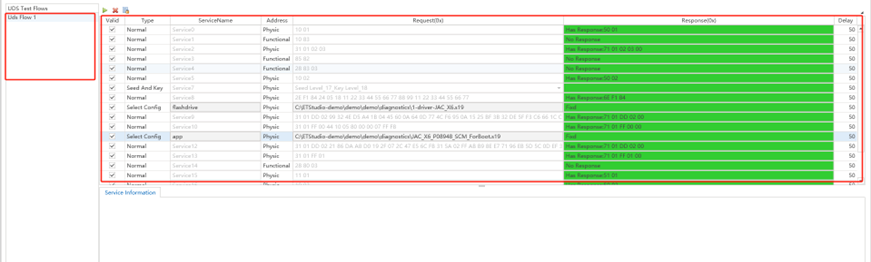
Configure the diagnostic process(UDS Flow)
Basic configuration steps
The basic steps to configure the diagnostic process are as shown in the following figure:
- Select a diagnostic process node in the Admin dashboard on the left.
- In the edit area on the right, add, remove, and edit diagnostic steps.
- After adding a step, edit the name of the step.
- Select the type of step.
- Select the address type of the step, whether it is a physical or functional address address.
- Configure detailed diagnostic requests and response packets.
Toolbar
The diagnostic process configuration toolbar is shown in the following image:
- Start the diagnostic process for the configuration.
- Interrupt the currently running diagnostic process.
- Toggle the editability of diagnostic process settings to prevent accidental modifications

Diagnostic step type
ETStudio supports four different step types, each suitable for different diagnostic scenarios:

- Normal steps:
- Best for: Simple diagnostic cases where both request and response data are predefined.
- Example:
- Requests: 10 03
- Expected response: 50 03 12 34
- Disposition:
Enter the request in the request field and the expected response in the response field. If the ECU does not provide a response, simply uncheck "Responsive".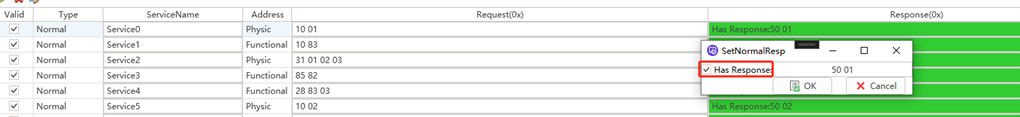
- Select Config: Select an existing configuration. The purpose of this configuration is to allow the user to select a diagnostic step that has been debugged in Diagnostics. The selection process is shown in the image below:
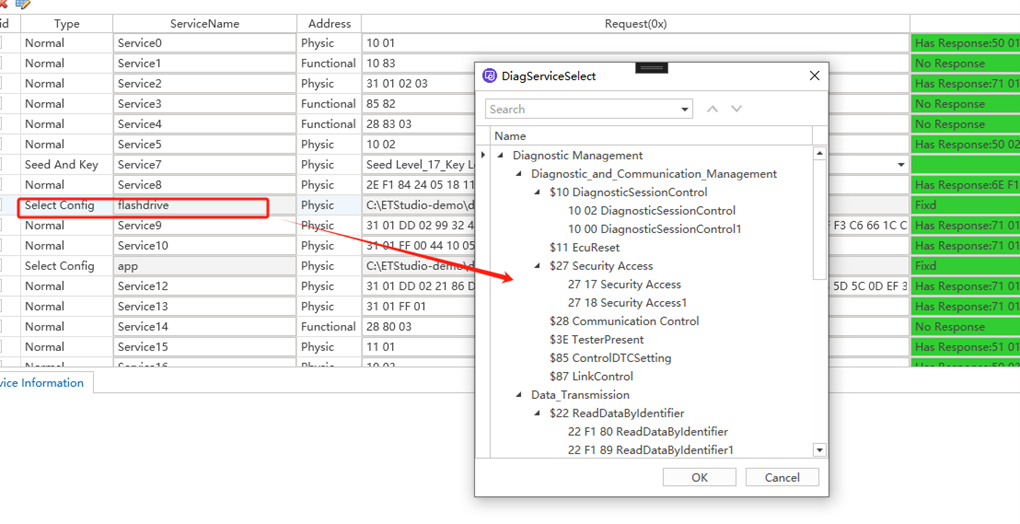
This method is the most recommended configuration method for ETStudio. Users can configure and test all child processes in the diagnostic console first, and then refer to the configuration in the automatic diagnostic process below. During the automated diagnostic process, its performance will be the same as in the diagnostic console.
- Seeds and key steps
- Purpose: To deal with secure authentication challenge mechanisms that require seeds and keys.
- Configuration options:
- Option A: Reference the existing SeedAndKey configuration via SelectConfig.
- Option B: Configure the type directly in the automation process by selecting SeedAndKey.
- Key parameters:
Just specify the SeedLevel.
Decrypting the DLL is automatically linked to the TP parameter configuration.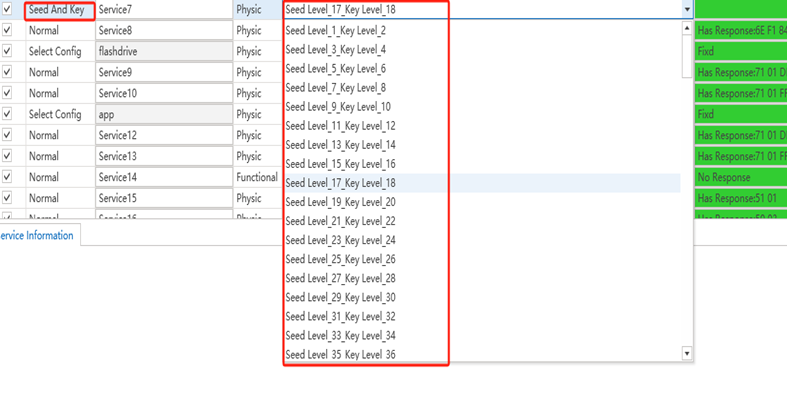
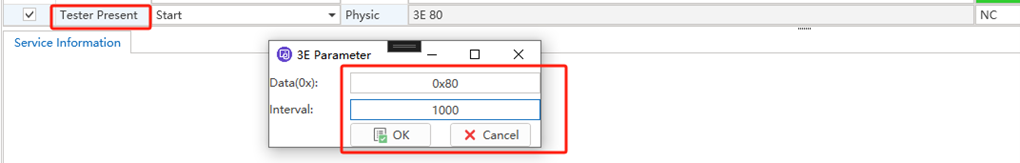
- Demonstrate the steps for the tester
- Purpose: To provide flexibility in managing the activation/deactivation of TesterPresent commands.
- Configuration parameters:
- Enable/Disable Commands: Toggle as required by testing.
- Command Data and Interval: Defines message content and transmission frequency.
C applet diagnostic test module implementation
Requests and responses are the basic elements of diagnosis, and sending a diagnostic request and getting a diagnostic response in CAPL is the most basic step of testing.
- Implementation steps
Define Test Conditions: Define test conditions based on actual hardware and software requirements, such as hardware checks, memory checks, communication checks, etc.
Implement test logic: Implement specific test logic in the runDiagnostics function, which can be done by reading register values and checking the status of communication interfaces.
Output results: Output corresponding log information based on test results for easy debugging and troubleshooting. - Integration into ETstudio
Create Project: Create a new C project in ETstudio.
Add code file: Copy the above code to the project's main file (e.g., main.c).
Compile and Download: Use ETstudio's compilation tools to generate the binary and download it to the target hardware.
Run tests: Observe test results through serial ports or debugging tools.
Engineering operation test
Manual diagnostic test dashboard
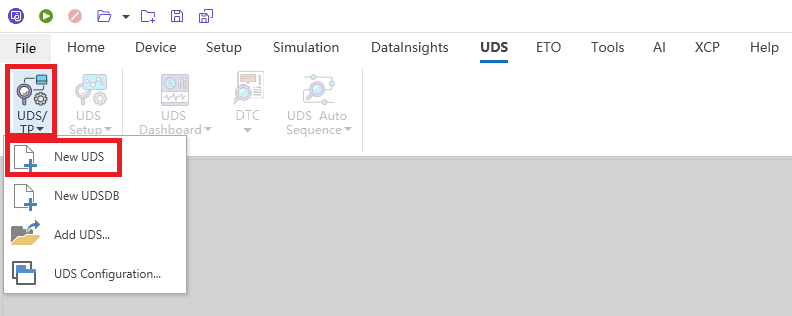
Fisrt of all,you need to create new UDS file,then you can use manual diagnostic test dashboard to send diagnostic request and receive response.
When the configuration interface appears later, select the appropriate configuration and save it.
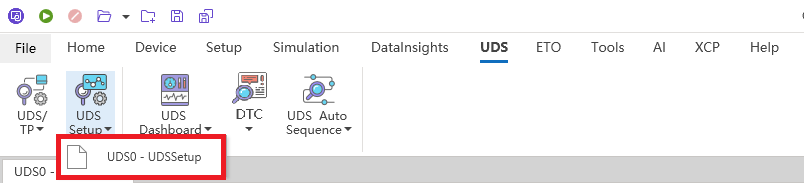
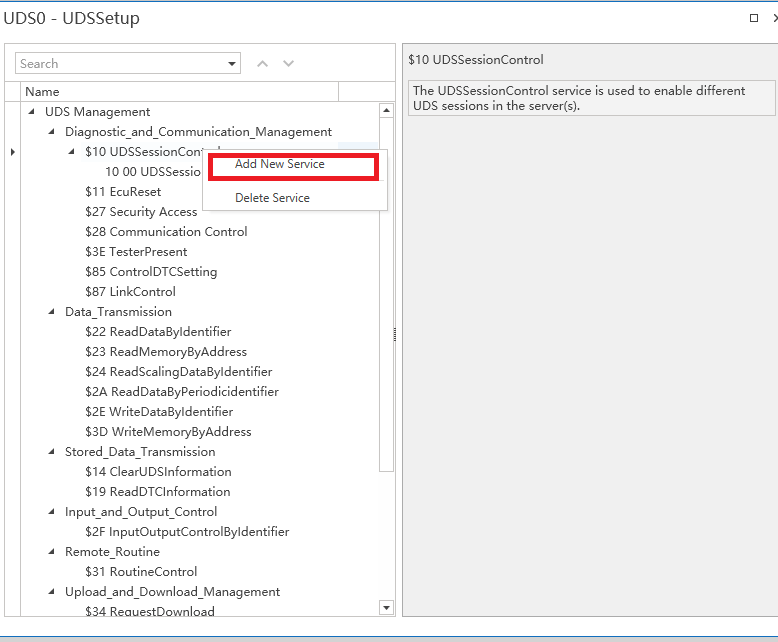
Then select UDS Setup for configuration, and right-click to add a new service.
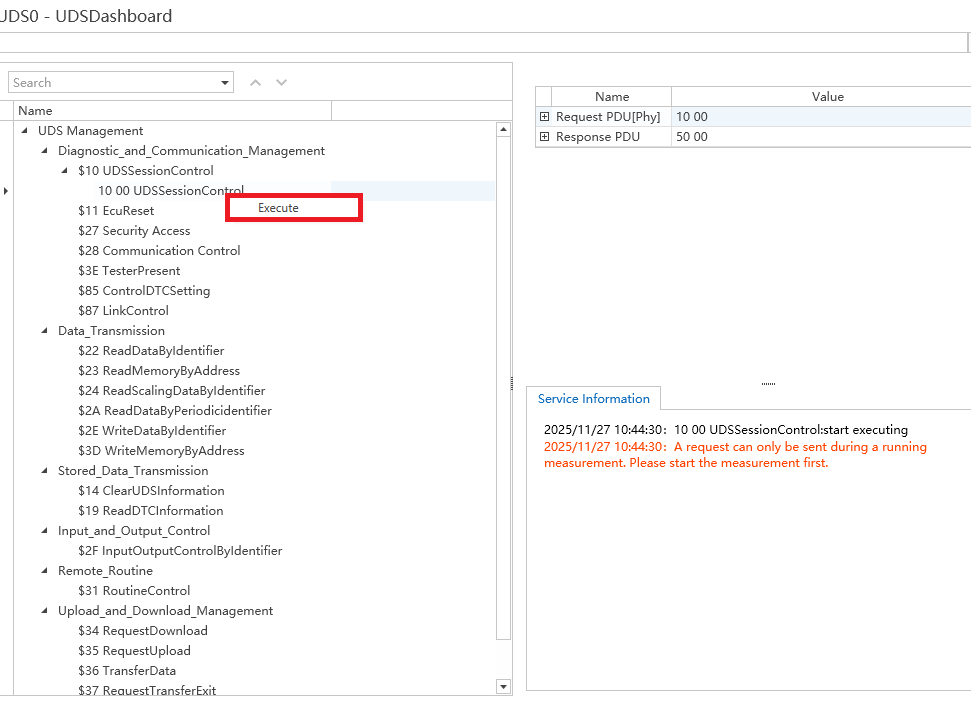
Right-click on execute to run.
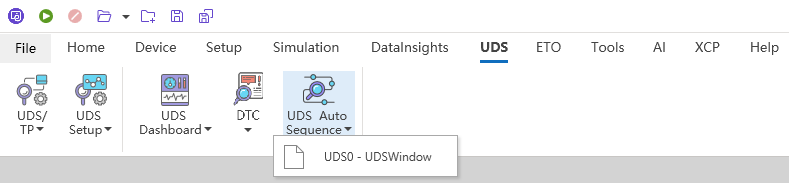
Automated diagnostic test module
Select the UDS Auto Sequence module, complete the corresponding configuration, and then run it to obtain the following results.