Overview of ETStudio Bus Measurement and Analysis
ETStudio's measurement and analysis are based on data flow, and the data can be individually processed, displayed, and recorded according to actual needs. In the Measurement Setup window, the data flow can be displayed and configured graphically, making data processing more intuitive. The data flow structure of ETStudio is shown in the figure:
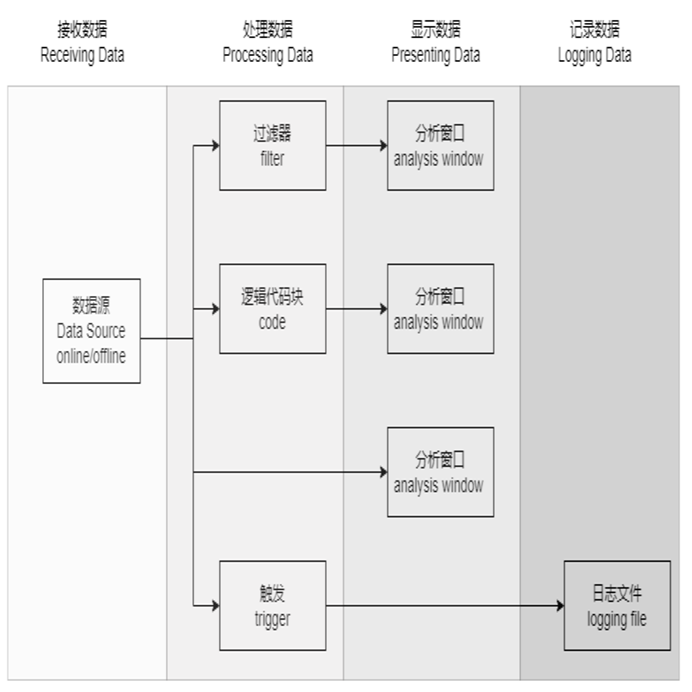
Received data: The source data for measurement analysis can be real-time data or offline data, which is determined according to the actual analysis needs. Real-time data is provided by simulation nodes or connected hardware devices, and offline data is often a log(.xcp) file containing data recorded over a period of time.
Processing data: Users can display the required data separately through filters, and from the effect point of view, the code scripts of the corresponding functions and the actively triggered behaviors are also part of the data processing process.
Display data: ETStudio provides an analysis window based on bus, packet, and signal data to meet different analysis needs
Logging data: The behavior of recording data is conducive to subsequent data analysis, and the software provides logging capabilities, which can actively set whether records are required as needed.
Common analysis windows
ETStudio provides graphical windows for analysis, statistics, comparison, filtering, and saving, which greatly facilitates data processing for users.
Timeline Trace function
The Timeline Trace function is mainly used in the automotive industry to analyze and simulate communication protocols. With a wide range of data analysis capabilities in CAN (Controller Area Network), LIN (Local Interconnect Network), and other vehicle bus systems, ETStudio's Timeline Trace window provides comprehensive capabilities for monitoring, diagnosing, and testing communication between on-board electronic control units (ECUs).
Feature support:
-
Supports CAN/CAN FD/LIN protocols
-
Absolute and relative time can be displayed
-
Supports scrolling display and fixed display
-
After DBC parsing, the signal value can be viewed directly
-
Supports channel filtering and ID filtering
-
The changed message bytes are highlighted
-
Error frames are highlighted in red (CAN/CAN_FD error frames are channel-intelligent, this will be optimized in future releases)
-
Different types of frames can be customized in color
-
Supports offline playback and supports .asc and .blf file formats
Timeline Trace window
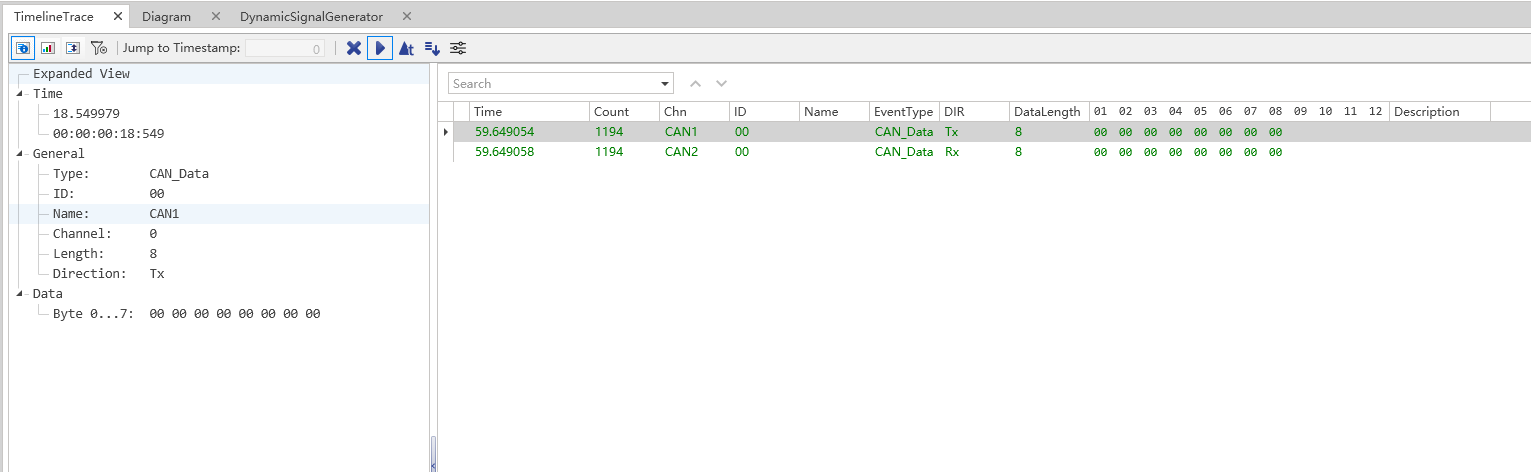
Timeline Trace Toolbar
To better provide data processing capabilities, the Timeline Trace window provides a toolbar, from left to right:
-
Detailed View: Displays the details of the frame, including signal information.
-
Statistic View: Displays statistics for frames.
-
Difference View: Displays the difference information between frames.
-
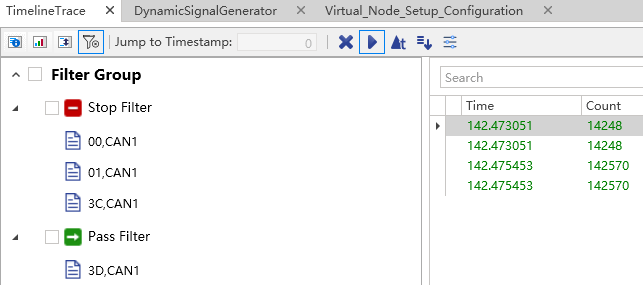
Analysis Filter: Filters frames based on selected message IDs.
-
Pass Filter: Allows selected frames to pass through through the analysis filter.
-
Stop Filter: Prevents selected frames from passing through through the analysis filter.
-
Go to time (seconds): You can locate the frame corresponding to the number of seconds you entered.
-
Clear: Clears all frames in the Timeline Trace window.
-
Pause/Resume: Pause or resume receiving frames.
-
Toggle time mode: Switches between absolute time and relative time (Delta Time).
-
Toggle display mode: Switch between fixed display mode and time-sorted display mode.
-
Filter Items for Diagnostics: Used to filter diagnostic frames in the Timeline Trace window. If the diagnostic function is not configured, this button will be disabled.
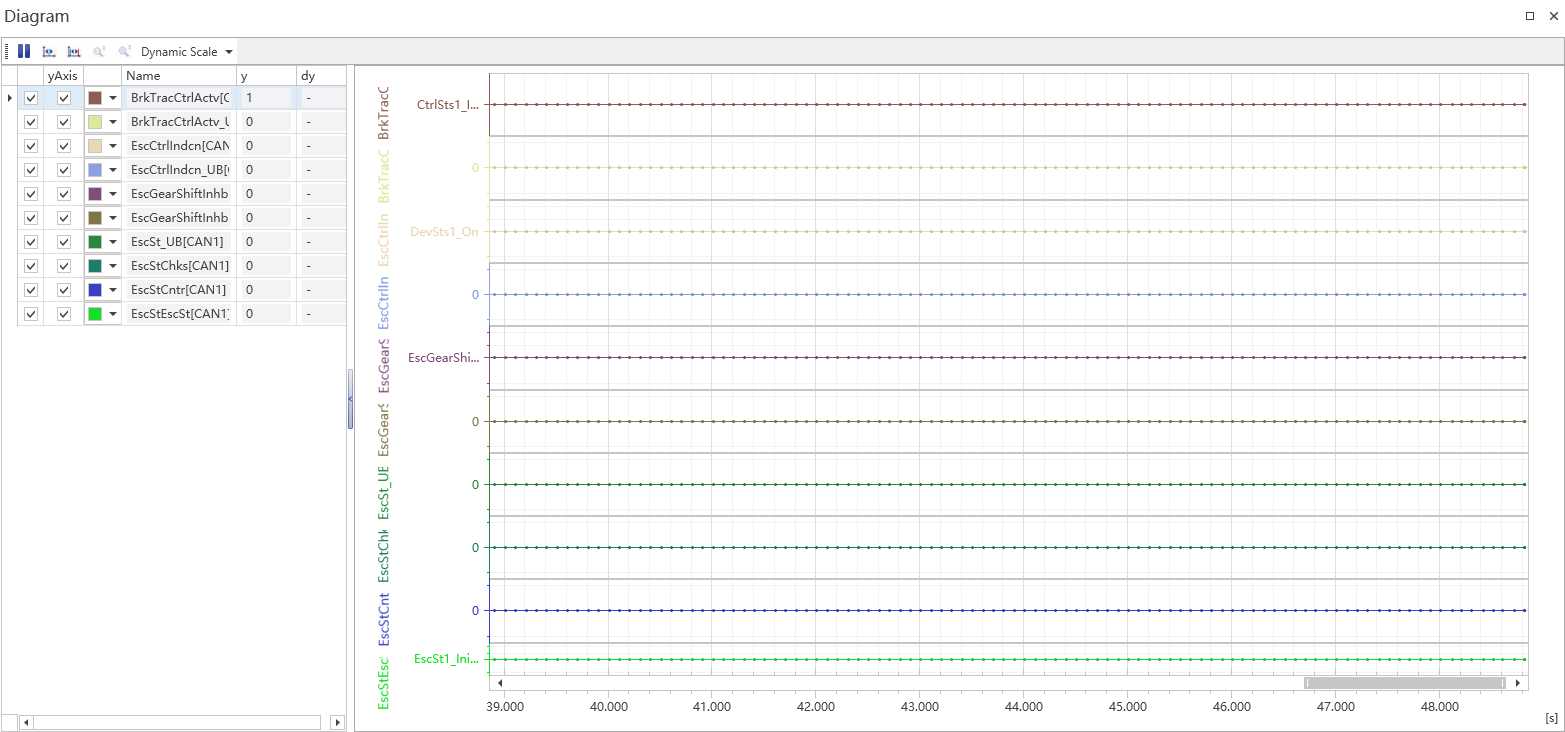
Diagram window
The Diagram window is a visual tool window used to display the data received from CAN, LIN, and system variables, and can be analyzed and saved through graphical functions such as scaling, measuring, printing, and exporting. Graphical functionality is included in BarMenu and SelectMenu, which is displayed when needed by right-clicking on an empty area of the left dashboard.
The features included in BarMenu and SelectMenu will be briefly described.
BarMenu
BarMenu provides start/stop, measure, differential measurement, zoom in, zoom out, print, print preview, and export functions.
1.Start/Stop: Click a button to refresh and pause graphical data
2.Measurement: Continuous optimization
3.Differential measurement: The graphical data refresh action must be paused when using this function, which can be distinguished according to the actual operation:
a.Differential Measurement for Unselected Signals: When the Difference-Measure button is clicked, blue and red constant lines will be displayed. Move either constant line to the data point you want to measure, and then move the other one. The timestamps and measured time intervals of the data points are displayed in the lower left corner of the graph chart. When you move the constant line, it automatically aligns to the nearest data point and displays the value of the signal.
b.Differential Measurement After Selecting a Signal: Click on the signal you wish to measure in the left dashboard of the graphical chart and select the Difference-Measure button. Then the blue and red constant lines are displayed. The operation is similar to differential measurement for unselected signals, but the constant line will align to the nearest data point of the selected signal and display the value of the signal.
4.Zoom: After moving the mouse to the target position (signal point, coordinate axis, chart), the zoom function can be achieved by scrolling the mouse wheel, and it can be resumed by Ctrl+Z.
5.Print-Preview: Print-Preview provides the ability to preview the current chart, allowing users to decide whether they need to save the preview image according to their actual needs.
6.Print: Print the current chart.
7.Export: Users can export their current charts as PDF, HTML, MHT, XLS, XLSX, RTF, DOCX, and image format files.
SelectMenu
SelectMenu provides functions such as adding CAN signals, adding LIN signals, adding variables, signal styles, crosshairs, removing selections, using combined views, and using split views, which can be selected according to your needs.
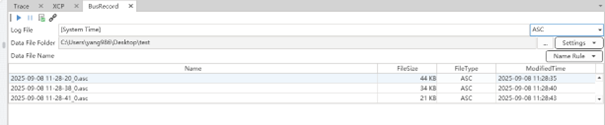
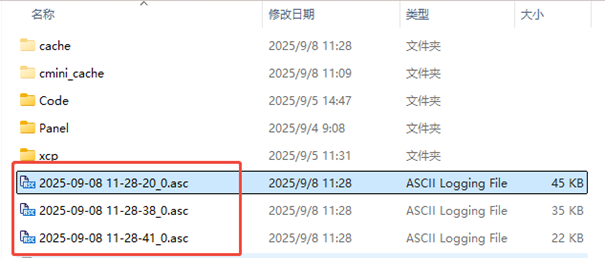
Packet Capture window
The packet capture window can be used to record the message data on the bus for a period of time, with the time as the file name, and stored as an ASC/BLF format file in the specified path.
Measurement data recording setup and processing
In order to better analyze the measurement results, ETStudio provides the ability to record data such as packets, signals, and variables during the measurement process to specified files, providing follow-up support for the storage and processing of measurement results.
Inactive analysis
ETStudio provides users with two simulation modes, Active (real-time) and Inactive (offline), which can be switched between the Home ribbon.
-
Active mode: Simulation measurement is based on real hardware device connection or simulation mode.
-
Inactive mode: ETStudio can be used with logged log files, which are enabled by the user after setting the file location and time parameters in offline mode. It is mainly used to further analyze the complex problems encountered.
Generator module
The generator module is mainly used in situations where the network architecture is relatively simple or requires user-defined trigger behavior, providing users with a convenient and efficient way to send messages.
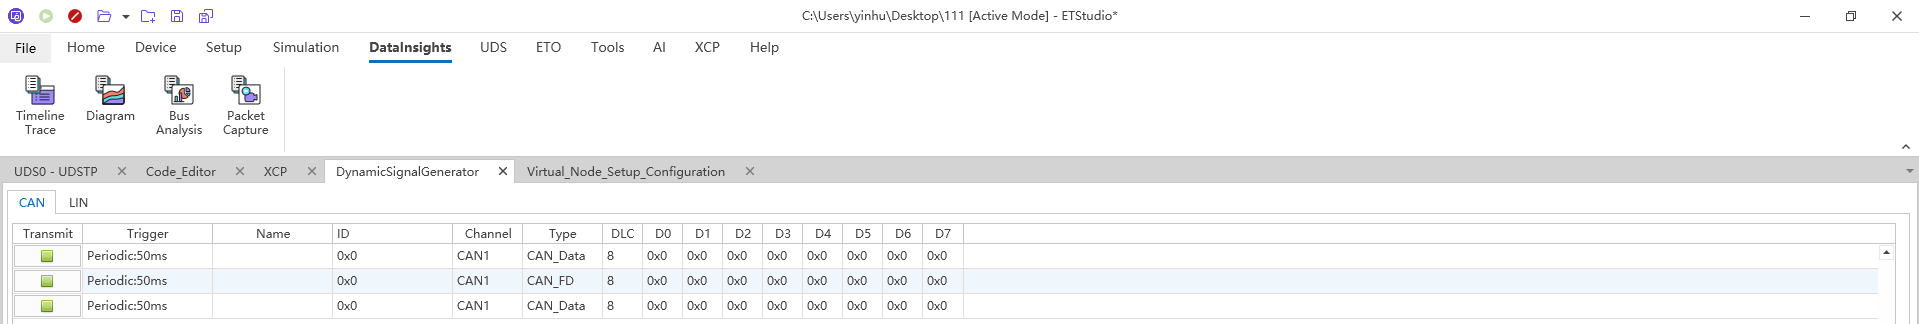
CAN Transmit
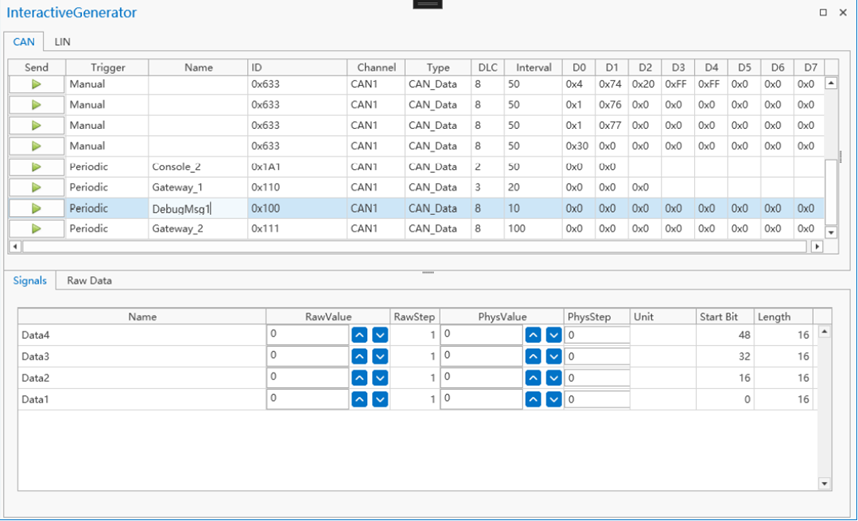 As shown in the figure, the CAN transmission window is mainly composed of two parts: the send list and the signal list.
Send list
Contains multiple messages to be edited, and the attributes of each message are Send, Trigger, Name, Id, Channel, Type, DLC, Interval, and D0~D7.
-
Send: Controls the current message being sent.
-
Trigger type: The user can choose to trigger a manual transmit message or a periodic transmit message according to their needs.
-
Name: The message name is defined by the user, and the signal name is displayed directly when the signal is imported from the CAN database.
-
Id: The identifier of the CAN message.
-
Channel: The channel through which CAN messages are sent.
-
Type: The frame type of CAN.
-
CAN_Data: Classic CAN dataframe for standard identifiers.
-
CAN_Remote: Classic CAN remote frame for standard identifiers.
-
CAN_FD: CAN FD frame for standard identifiers.
-
Extended_CAN_Data: Extended classic CAN dataframe for identifiers.
-
Extended_CAN_Remote: Classic CAN remote frame for extended identifiers.
-
Extended_CAN_FD: CAN FD frame for extended identifiers.
-
-
DLC (Data Length Code): The length code of the CAN message, the range is 0~15.
-
Interval: The CAN message sending period, ranging from 1~1000ms.
-
D0~D7: Dataframe byte editor
Signal list
Used to display selected CAN messages from the CAN database and provides the ability to edit message properties. Contains the following attributes:
-
Signal Name: The name of the signal defined in the CAN database.
-
Raw Value: The raw value editor for the currently selected signal. To modify the original value of a signal without affecting its physical value, use this editor.
-
Raw Step Value: Incremental or decremental step of the original value field.
-
Physical Value: The physical value editor for the currently selected signal. To modify the physical value of a signal without affecting its original value, use this editor.
-
Phys step: Incremental or decremental step for the physical value field.
LIN Transmit
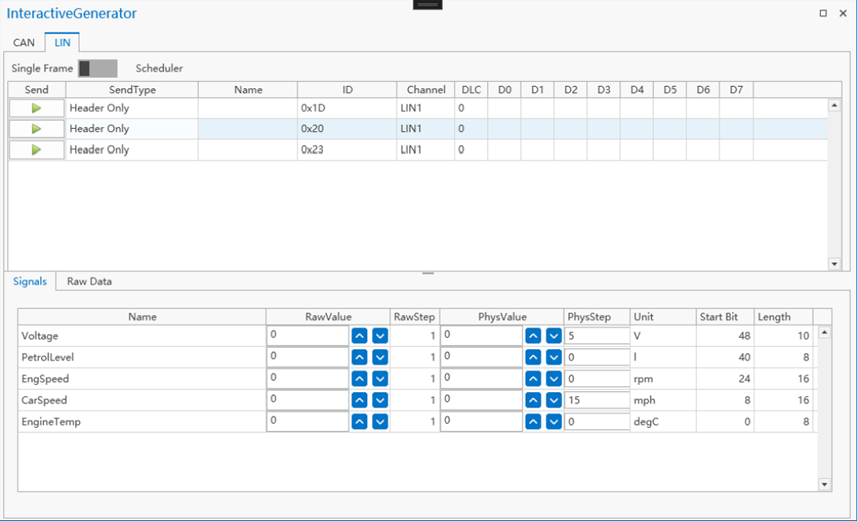
As shown in the figure, the LIN sending window is mainly composed of two parts: the send list and the signal list.
Send list
Contains multiple messages to be edited, and the attributes of each message are Send, Active, Name, Id, Channel, SendType, DLC, Interval, and D0~D7.
-
Send: Sends a LIN message every time you click on it.
-
Active (trigger activation): Activate/deactivate the current LIN.
-
Name: The message name is defined by the user, and the signal name is displayed directly when the signal is imported from the LIN database.
-
Id: The identifier of the LIN message.
-
Channel: The channel through which LIN messages are sent.
-
Type: The frame type of the LIN.
-
Header Only: The head that sends the LIN frame.
-
Response Only: Send a response to the LIN frame.
-
Header And Response: The header and response that sent the LIN frame.
-
-
DLC (Data Length Code): The length code of the CAN message, the range is 0~15.
-
Interval: The CAN message sending period, ranging from 1~1000ms.
D0~D7: Dataframe byte editor
Signal list
Used to display LIN messages selected from the LIN database and provides the ability to edit message properties. Contains the following attributes:
-
Signal Name: The name of the signal defined in the LIN database.
-
Raw Value: The raw value editor for the currently selected signal. To modify the original value of a signal without affecting its physical value, use this editor.
-
Raw Step Value: Incremental or decremental step of the original value field.
-
Physical Value: The physical value editor for the currently selected signal. To modify the physical value of a signal without affecting its original value, use this editor.
-
Phys step: Incremental or decremental step for the physical value field.